Preface
Goal: Filling the cell with total column and row.
In the upcoming section, our objective is to enhance the pivot table by incorporating total columns and rows. This addition will contribute to a comprehensive pivot table based on the existing plain table.
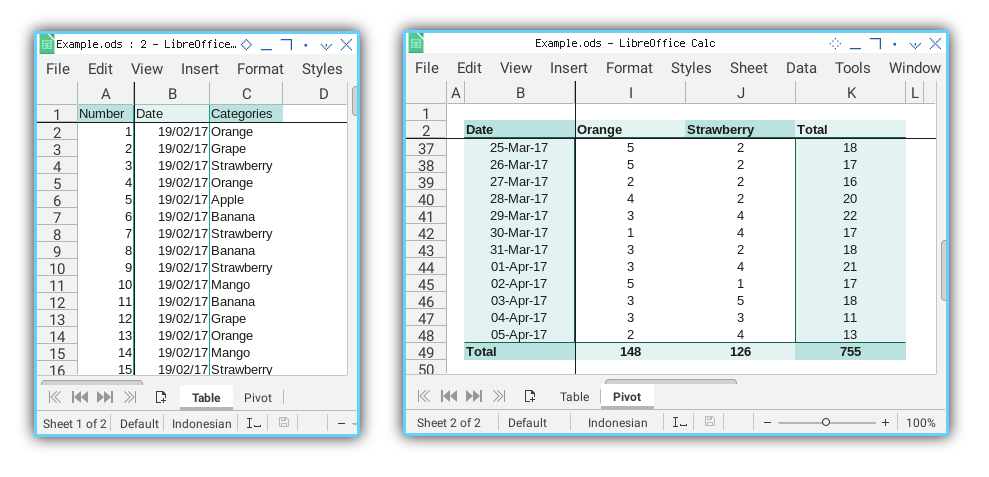
Total: Main Macro
We will be modifying the Pivot class
to include total columns and rows.
Enhanced each step with a few simple decoration.
Libraries
No changes in code, it remains intact. The import clause for this Calc Macro stays exactly the same.
Macro Structure
No changes in code, it remains intact. The macro structure remains consistent with the previous setup.
Main Method
The main method retains its form,
consistent with the previous article.
We will proceed with adjustments in the PivotWriter class.
Total: Main Macro
Let’s tailor our PivotWriter class.
Class Diagram
The complete diagram provides a visual representation as follows:
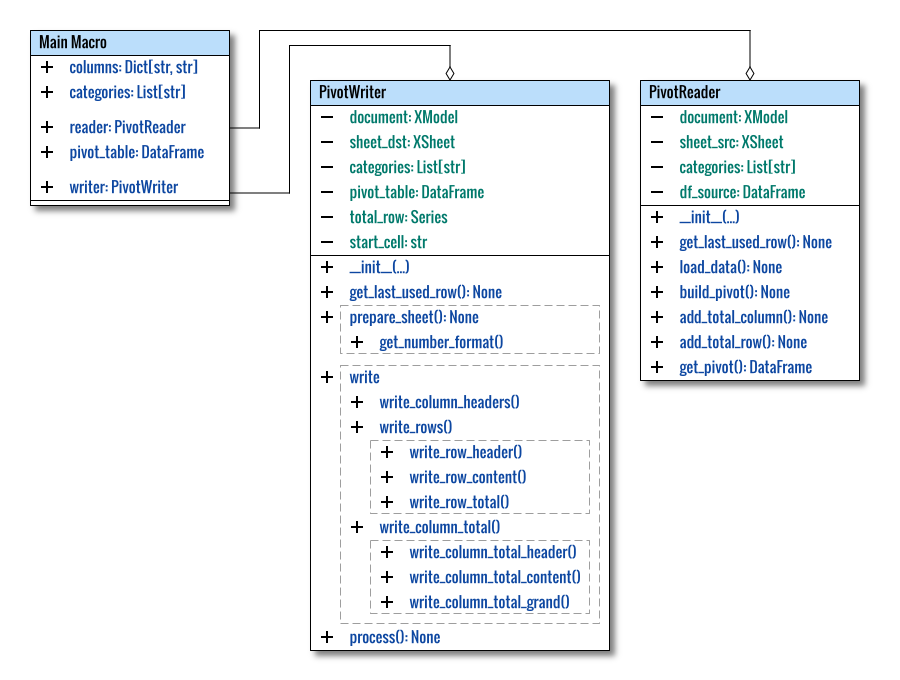
This offers a comprehensive illustration of the overall structure. I present the main macro as a class. As usual, this conceptual diagram prioritizes clarity over adhering strictly to standard UML conventions.
Class Skeleton
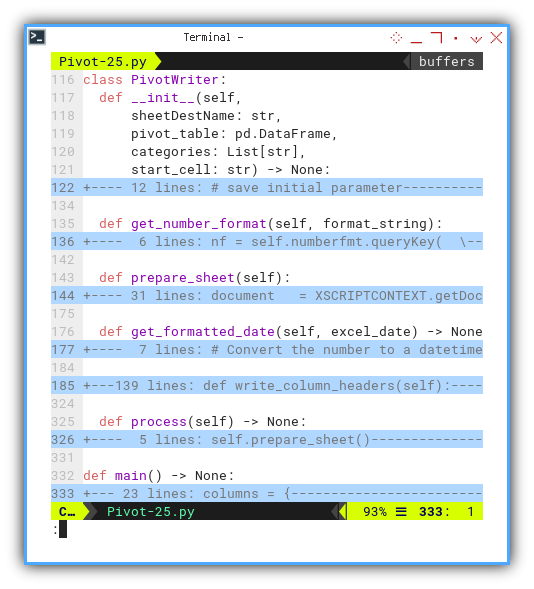
The class appears more complex now. By examining the skeleton, the process becomes evidently clear.
Temporarily concealing the cell writing part, allows us to grasp the bigger picture.
class PivotWriter:
  def __init__(self,
      sheetDestName: str,
      pivot_table: pd.DataFrame,
      categories: List[str],
      start_cell: str) -> None:
    ...

  def get_number_format(self, format_string):
    ...

  def prepare_sheet(self):
    ...

  def get_formatted_date(self, excel_date) -> None:
    ...

  # Some def doing cell writing  here
  ...

  def process(self) -> None:
    ...
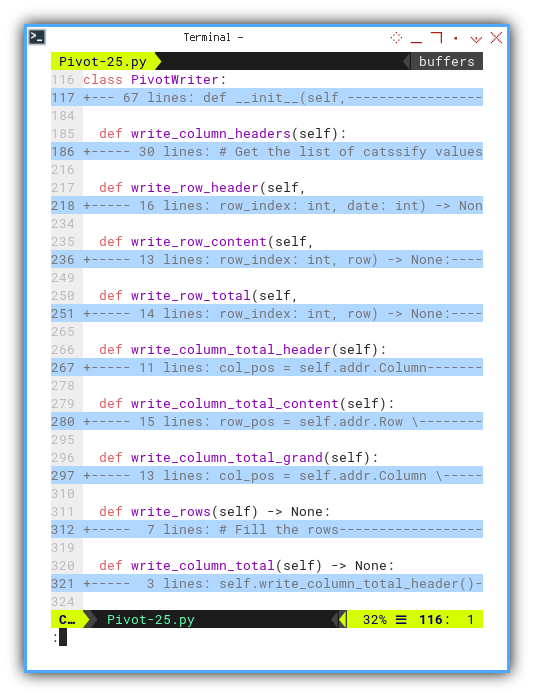
Zooming in on the writing part, we can observe the distinctions below:
  def write_column_headers(self):
    ...

  def write_row_header(self,
      row_index: int, date: int) -> None:
    ...

  def write_row_content(self,
      row_index: int, row) -> None:
    ...

  def write_row_total(self,
      row_index: int, row) -> None:
    ...

  def write_column_total_header(self):
    ...

  def write_column_total_content(self):
    ...

  def write_column_total_grand(self):
    ...

  def write_rows(self) -> None:
    ...

  def write_column_total(self) -> None:
    ...
Initialization
This section remains exactly the same as in the previous article.
Prepare Sheet
The process is nearly identical to the one in the previous article, with the addition of freeze panes and the removal of the grid:
  def prepare_sheet(self):
    ...

    # sheet wide
    spreadsheetView.ShowGrid = False
    spreadsheetView.freezeAtPosition(
      self.addr.Column + 1, self.addr.Row + 1)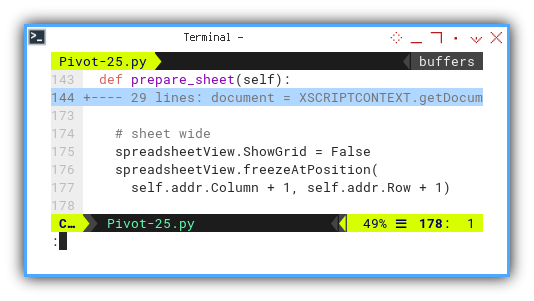
Internal Diagram
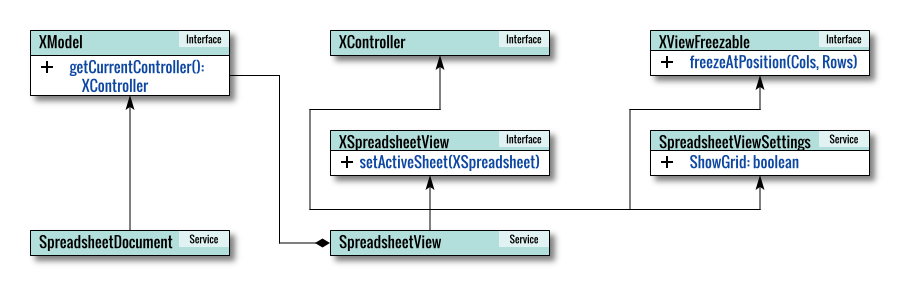
To aid in understanding the internal workings of the LibreOffice API, let’s visualize the services and interfaces involved.
Process Flow
The flow is depicted here, with only one additional line:
  def process(self) -> None:
    self.prepare_sheet()

    self.write_column_headers()
    self.write_rows()
    self.write_column_total()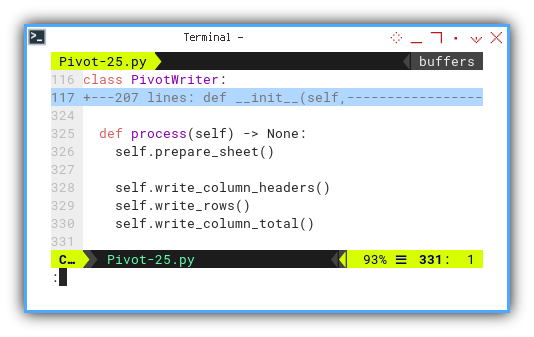
Expressing this process more concisely:
  def process(self) -> None:
    self.prepare_sheet()

    self.write_column_headers()

    # Fill the rows
    row_index = 0
    for date, row in self.pivot_table.iterrows():
      row_index += 1
      self.write_row_header(row_index, date)
      self.write_row_content(row_index, row)
      self.write_row_total(row_index, row)

    self.write_column_total_header()
    self.write_column_total_content()
    self.write_column_total_grand()
The flow is clear with this structure.
Total: Filling Content
The essence of actual cell writing lies within this section.
Column Headers
The column header remains largely unchanged, with two notable enhancements:
- Additional
Totalcolumn - A more compact column gap on the left and right for seamless copy-pasting of results into platforms like WhatsApp while maintaining an appealing appearance.
  def write_column_headers(self):
    # Get the list of catssify values
    lookup_cats = ['Date'] + self.categories + ['Total']

    # Fill the cells horizontally
    for col, cat in enumerate(lookup_cats, start=0):
      ...

    column = self.sheet_dst. \
      getColumns().getByIndex(0). \
      Width = 500
    column = self.sheet_dst. \
      getColumns().getByIndex(len(lookup_cats) + 1). \
      Width = 500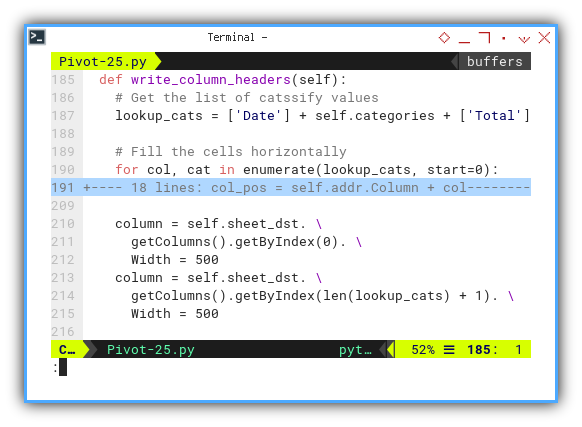
The Rows Flow
The sequence of the rows writing, relies on iteration over the row the dataframe. Now we have total column at the right of the table.
The flow of writing rows, relies on iterating over the rows of the dataframe. Now, with the addition of a total column to the right of the table, the sequence is adapted accordingly.
  def write_rows(self) -> None:
    # Fill the rows
    row_index = 0
    for date, row in self.pivot_table.iterrows():
      row_index += 1
      self.write_row_header(row_index, date)
      self.write_row_content(row_index, row)
      self.write_row_total(row_index, row)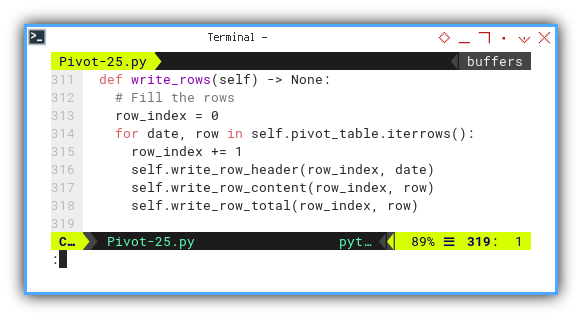
Row Headers
The row header mirrors the structure of the previous code, except that I remove the print line.
I think I’ve got enough checking.
Content
Access dataframe using:
row[('Number', cat)]
The content remains identical.
Row Total
Access dataframe using:
row[('Total Date')]
This introduces a new method, which is quite self-explanatory.
The process involves locating the address position of the cell,
retrieving the value from row[('Total Date')],
and proceeding with the cell decoration.
  def write_row_total(self,
      row_index: int, row) -> None:

    # Cell Address
    col_pos = self.addr.Column \
            + len(self.categories) + 1
    row_pos = self.addr.Row + row_index

    cell = self.sheet_dst. \
      getCellByPosition(col_pos, row_pos)
    cell.Value = int(row['Total Date'])

    cell.HoriJustify = CENTER # or just 2
    cell.LeftBorder = self.lineFormat
    cell.CellBackColor = tealScale[0]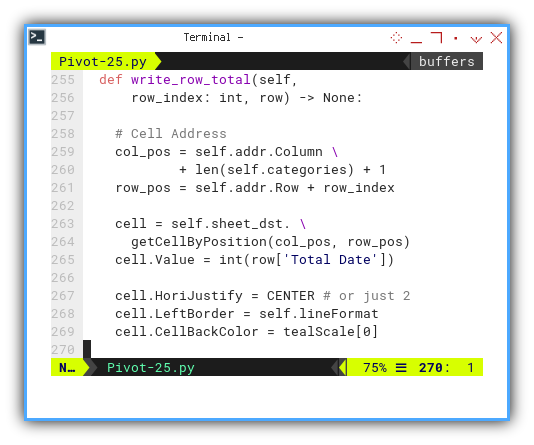
Total: The Total Column
This represents the bottommost row, capturing the sum of each column.
Total Column Flow
The skeleton of the total column writer follows this flow:
- First Column: A cell containing
Totallabel - Data Columns: Multiple cells with totals for each category.
- Last Column: A single cell for the grand total.
  def write_column_total(self) -> None:
    self.write_column_total_header()
    self.write_column_total_content()
    self.write_column_total_grand()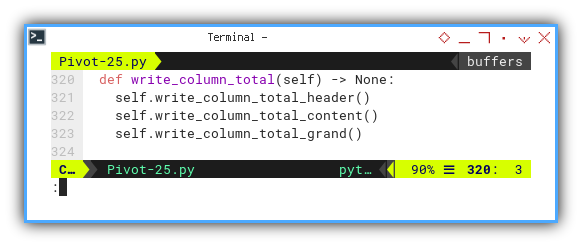
Writing Total Column Total: Header
The
Totallabel.
Maintaining respect for the cell’s starting address, we calculate the location index.
  def write_column_total_header(self):
    # calculate position, respect start cell
    col_pos = self.addr.Column
    row_pos = self.addr.Row \
            + len(self.pivot_table) + 1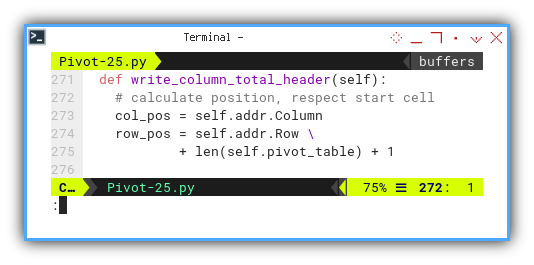
There is nothing special here.
just the Total label.
    cell = self.sheet_dst. \
      getCellByPosition(col_pos, row_pos)
    cell.String = 'Total'

    cell.CharWeight = BOLD
    cell.TopBorder = self.lineFormat
    cell.CellBackColor = tealScale[1]
Writing Total Column Totals: Content
Access dataframe using:
row[('Number', cat)]
Respecting the cell’s starting address, we calculate the row position index.
  def write_column_total_content(self):
    # calculate position, respect start cell
    row_pos = self.addr.Row \
            + len(self.pivot_table) + 1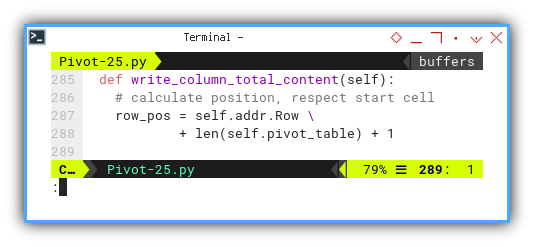
Iterating through the row using enumerate,
the value for each bottom total can be
obtained with row[('Number', cat)].
If the count value is zero,
the total is displayed as zero in that bottom cell.
    # Fill the cells horizontally
    for col, cat in enumerate(self.categories, start=1):
      col_pos = self.addr.Column + col

      cell = self.sheet_dst. \
        getCellByPosition(col_pos, row_pos)
      cell.Value = int(self.total_row[('Number', cat)])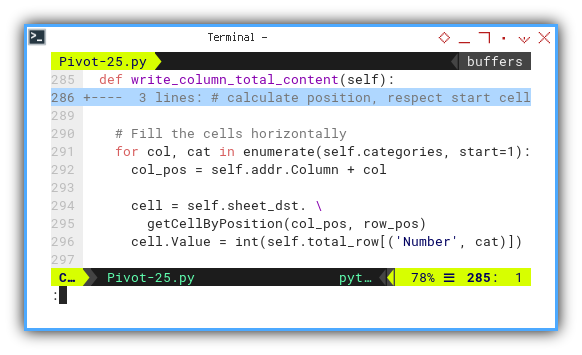
Additionally, we need to decorate the bottom total to distinguish its appearance.
      cell.CharWeight = BOLD
      cell.HoriJustify = CENTER # or just 2
      cell.TopBorder = self.lineFormat
      cell.CellBackColor = tealScale[0]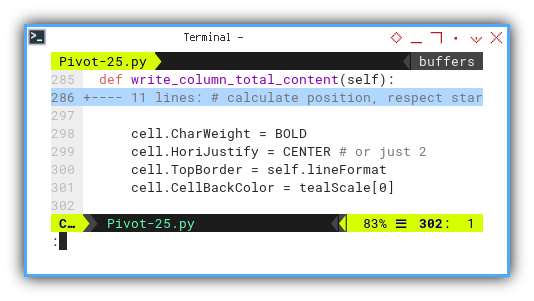
Writing Total Column Total: Grand Total
Access dataframe using:
row[('Total Date')]
The cell address index is simply the starting point plus the length.
  def write_column_total_grand(self):
    # calculate position, respect start cell
    col_pos = self.addr.Column \
            + len(self.categories) + 1
    row_pos = self.addr.Row \
            + len(self.pivot_table) + 1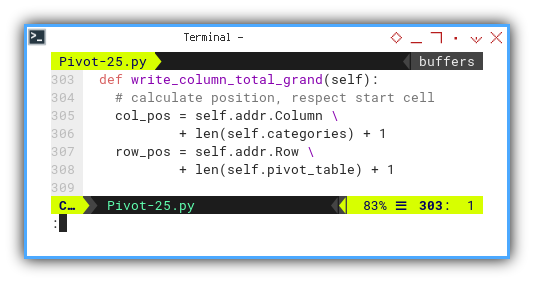
Again, decorating the grand total.
    cell = self.sheet_dst. \
      getCellByPosition(col_pos, row_pos)
    cell.Value = int(self.total_row['Total Date'])

    cell.CharWeight = BOLD
    cell.HoriJustify = CENTER # or just 2
    cell.TopBorder = self.lineFormat
    cell.CellBackColor = tealScale[1]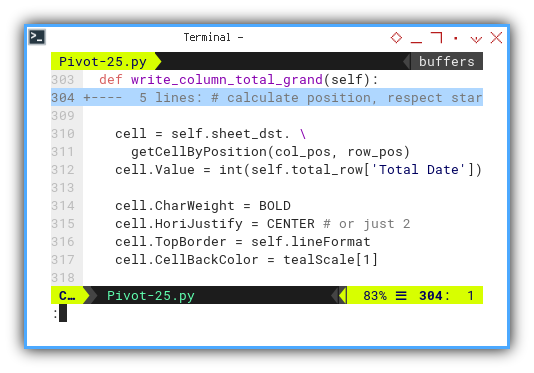
Activity Diagram
Paths of Unbroken Time
Summarizing the entire process in timeline, the chronological order is illustrated in this activity diagram.
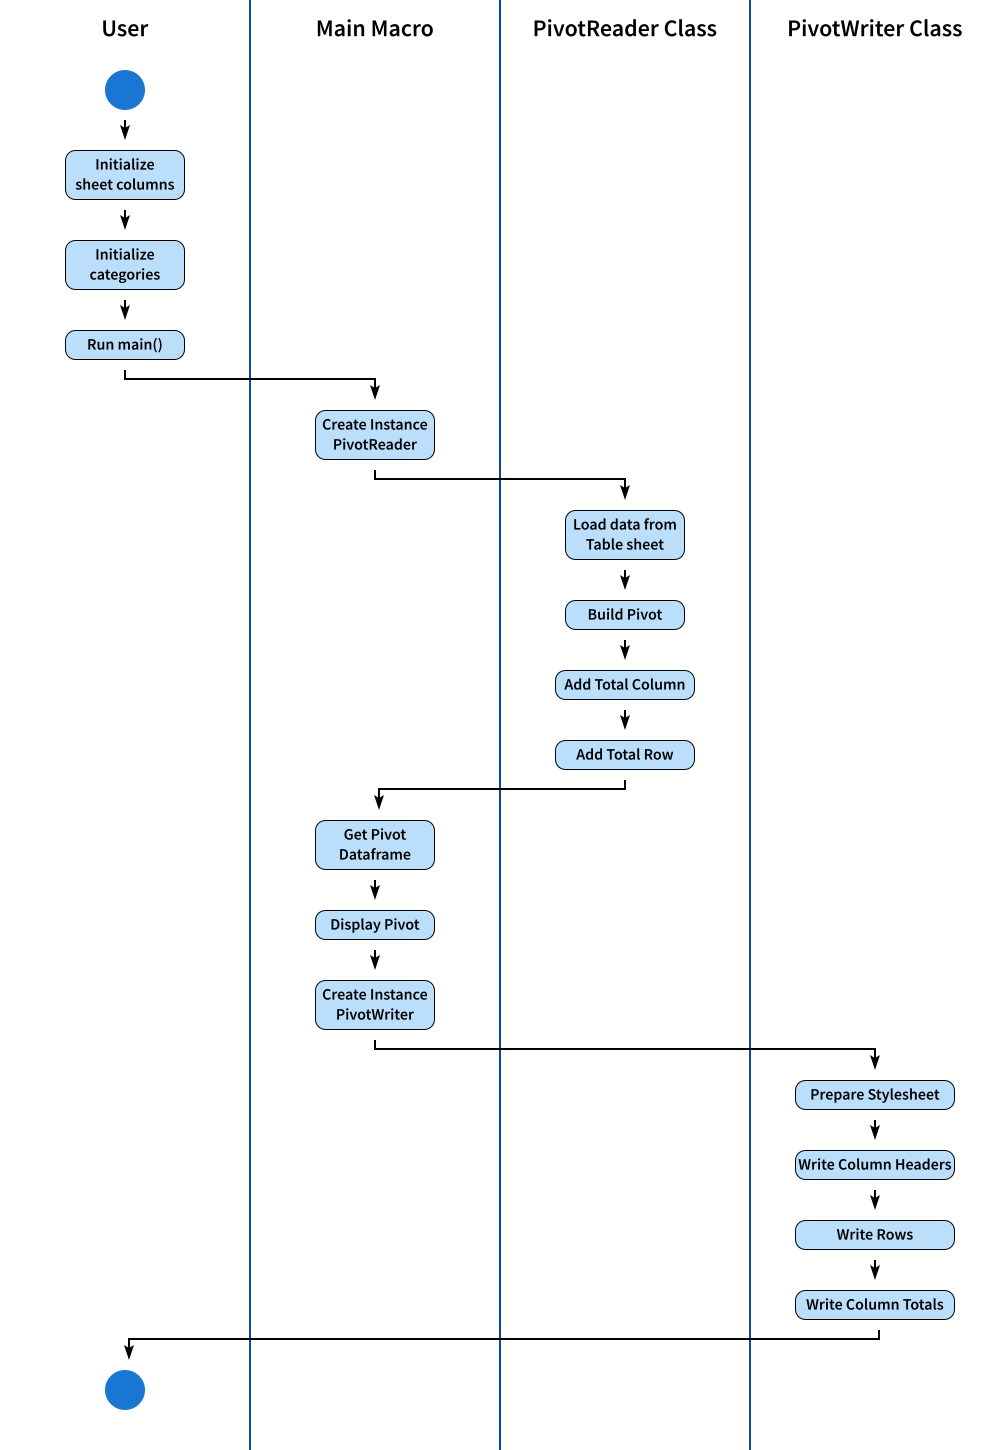
The SVG source can be obtained here, for you to modify to suit your needs.
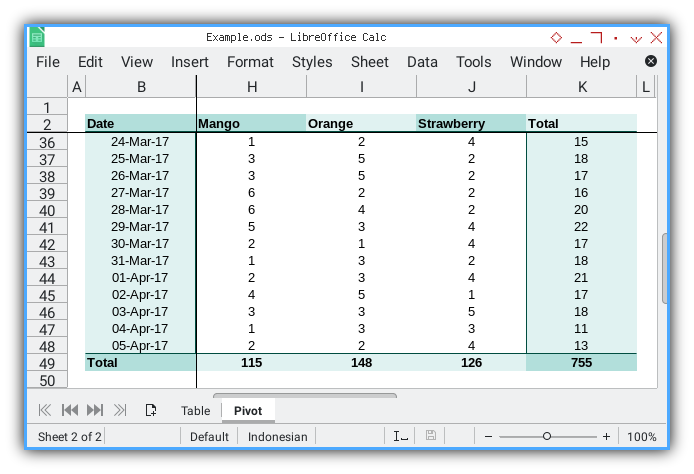
Total Result
The final result is displayed in the screenshot below:
What Comes Next 🤔?
In real-life scenarios, the circumstances can differ. While you might anticipate receiving a clean sheet as the data source, your client might opt to provide a raw CSV file instead. In such cases, you’ll need an empty workbook where you can write both the table sheet and the pivot sheet based on the dataframe extracted from a CSV file.
Consider continuing your exploration in the next section: [ Pivot - Calc Macro - CSV Reader ].