Preface
Goal: Create a Model View Class. Ensure categories.
As usual, it’s beneficial to restructure the class using the model-view pattern for further use.
Model View: Main Script
It is a good idea, to separate the data model and the output display. Because we can have one model, but multiple views. In this case we can have one pivot table, and then we can choose to display data representation in terminal console, or export it to XLSX file using openPyXl, or render the cell one by one using LibreOffice Macro.
Class Diagram
Visualization aids in learning, especially when provided upfront. For clarity, I haven’t strictly adhered to the standard UML diagram.
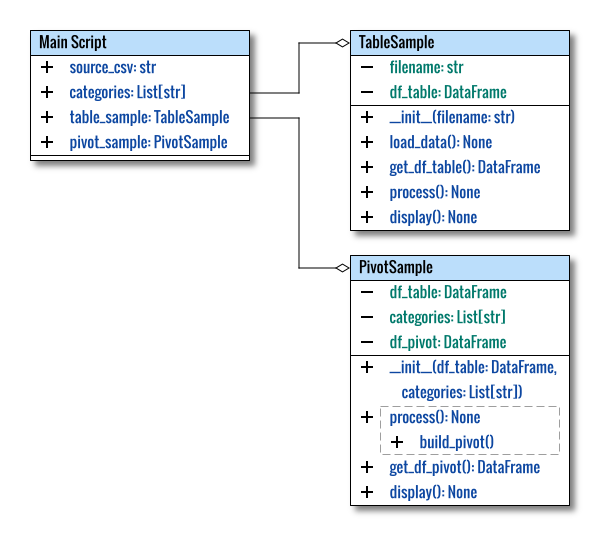
The class diagram above was created using the multiple pages feature in Inkscape. The source can be obtained here for your customization.
On the browser, only the first image is shown. You can use Inkscape to explore more pages.
Directory Structure
We are also going to organize the class into its own lib directory.
.
├── 12-model-view.py
└── lib
    ├── PivotSample12.py
    └── TableSample.py
Since the TableSample is simple enough to be matured.
We will remove the numbering,
and use this class throughout the tutorial.
Program Entry Point
The main script is as below:
#!/usr/bin/env python3

import pandas as pd

# Local Library
from lib.TableSample import TableSample
from lib.PivotSample12 import PivotSample

def main() -> None:
  ...

if __name__ == "__main__":
  main()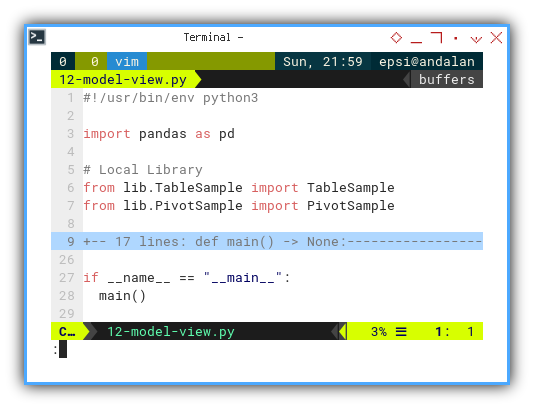
Categories
Besides total, we should also ensure, that the data matches the predefined category.
  categories = [
    "Apple", "Banana", "Dragon Fruit",
    "Durian", "Grape", "Mango",
    "Orange", "Strawberry"]
Main Method
Now we can put the categories in the main method.
def main() -> None:
  source_csv = 'sample-data.csv'
  categories = [
    "Apple", "Banana", "Dragon Fruit",
    "Durian", "Grape", "Mango",
    "Orange", "Strawberry"]

  pd.set_option('display.max_rows', 10)

  table_sample = TableSample(source_csv)
  table_sample.process()
  table_sample.display()

  pivot_sample = PivotSample(
    table_sample.get_df_table(), categories)
  pivot_sample.process()
  pivot_sample.display()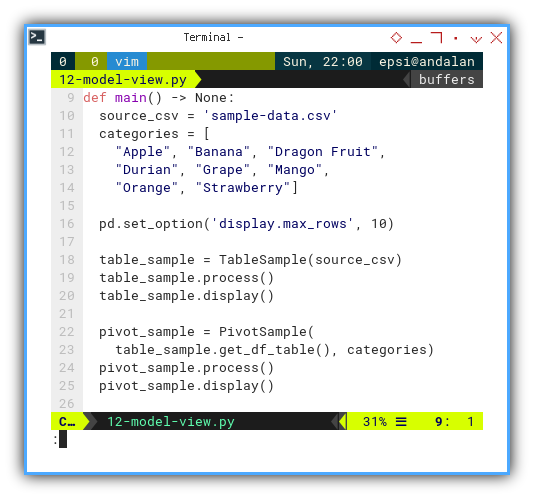
This way, I can comment unnecessary display, without even touching the class code.
There is also a slight change.
I use table_sample.get_df_table() method,
as a feed to the pivot class instance.
This is a method instead of just property in previous code.
You can also set max_rows,
to limit the number of displayed rows.
pd.set_option('display.max_rows', 10)Model View: Table Sample Class
Regardless of the class’s length, organization is essential. The process and the output remain identical to the previous article, with the only change being the class structure.
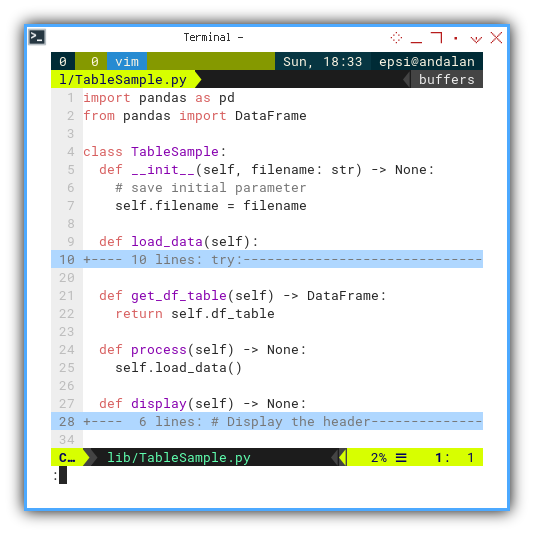
Class Skeleton
The class skeleton is as follows:
import pandas as pd
from pandas import DataFrame

class TableSample:
  def __init__(self,
      df_table: DataFrame,
      categories: List[str]) -> None:
    ...

  def load_data(self):
    ...

  def get_df_table(self) -> DataFrame:
    return self.df_table

  def process(self) -> None:
    self.load_data()

  def display(self) -> None:
    ...
Load Data
Nothing special. Just tidied up some code
  def load_data(self):
    try:
      # Load data into a DataFrame
      self.df_table = pd.read_csv(self.filename)

    except FileNotFoundError:
      print("Error: The file "\
         + f"'{self.filename}' was not found.")
    except Exception as e:
      print("An error occurred "
         + f"while loading data: {e}")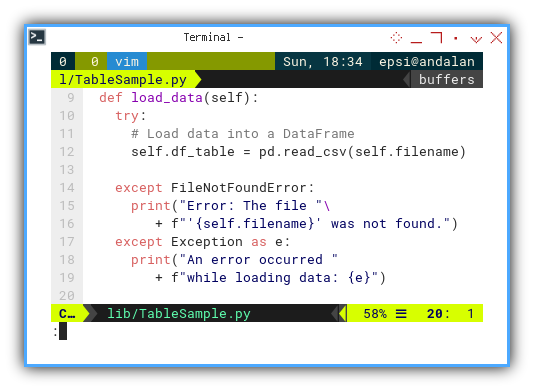
Display
Nothing special here either, just separating the view-related code.
  def display(self) -> None:
    # Display the header
    print("Header:", self.df_table.columns)

    # Display the data
    print("Data:")
    print(self.df_table)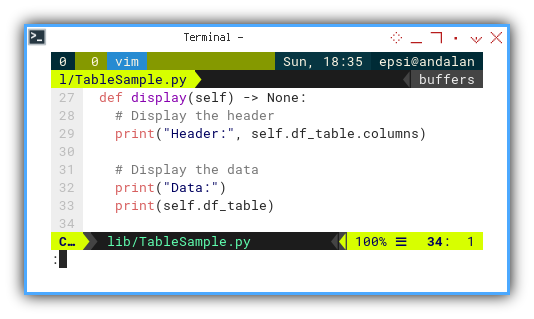
Terminal Result
The same as in the previous iteration.
Model View: Pivot Sample Class
This class needs to be prepared for further use.
Library
This is the library required by this class:
import pandas as pd

from datetime import datetime
from typing import List
from pandas import DataFrame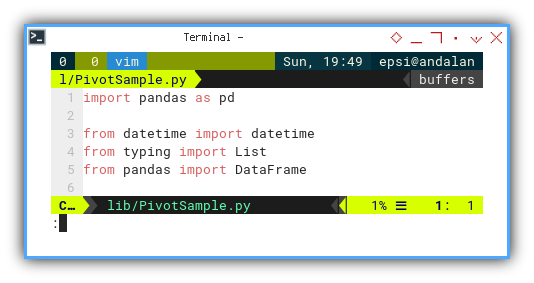
Class Skeleton
The PivotSample class is quite simlar,
except that I added build_pivot() and display() methods.
class PivotSample:
  def __init__(self,
      df_table: DataFrame,
      categories: List[str]) -> None:
    ...

  def build_pivot(self) -> None:
    ...

  def access_headers_and_column(self):
    ...

  def get_df_pivot(self) -> DataFrame:
    return self.df_pivot

  def process(self) -> None:
    self.build_pivot()

  def display(self) -> None:
    # Display the pivot table
    print("Pivot Table:")
    print(self.df_pivot)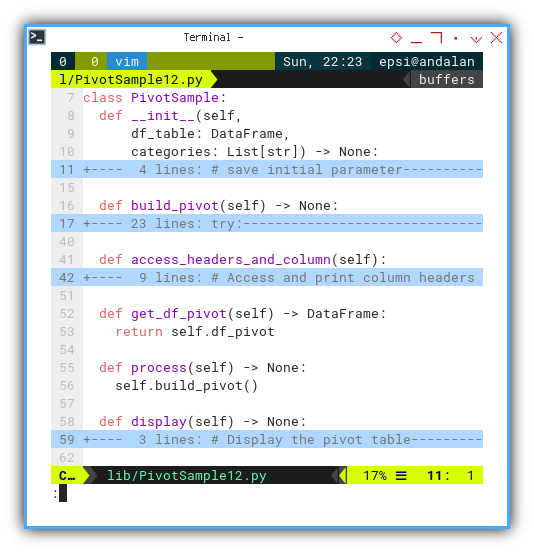
Initialization
The __init__ now accept categories argument.
We need to save initial parameters.
  def __init__(self,
      df_table: DataFrame,
      categories: List[str]) -> None:

    self.df_table = df_table
    self.categories = categories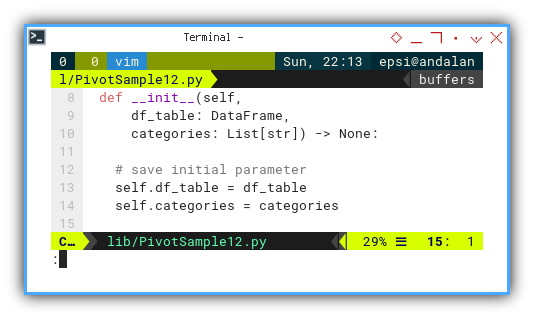
Build Pivot
Besides separating model-related code. I also appended additional lines.
- Ensure Categories
- Sorting Columns
  def build_pivot(self) -> None:
    try:
      # Perform pivot operations
      df_pivot = self.df_table.pivot_table(
        index='Date', columns='Fruit',
        aggfunc='count', fill_value=0)

      # Sort the index by both month and day
      df_pivot.index = df_pivot. \
        index.to_series().apply(lambda x:
          datetime.strptime(x, "%d/%m/%Y").date())
      df_pivot = df_pivot.sort_index()

      # Ensure all specified columns are present
      for cat in self.categories:
        if ('Number', cat) not in df_pivot.columns:
          df_pivot[('Number', cat)] = 0

      # Sort the columns (fruits) in alphabetical order
      self.df_pivot = df_pivot.sort_index(axis=1)

    except Exception as e:
      print("An error occurred " \
        + f"while processing data: {e}")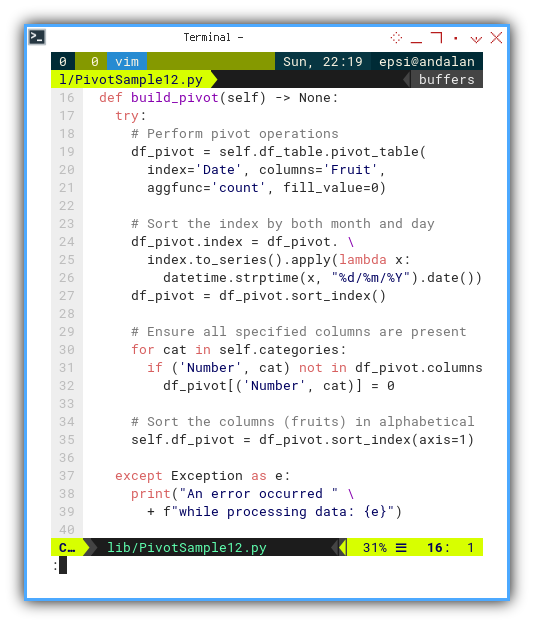
Ensure in Build
I appended this line as a process chain in building pivot process, to ensure all specified columns are present
      for cat in self.categories:
        if ('Number', cat) not in df_pivot.columns:
          df_pivot[('Number', cat)] = 0
The Multi Index here consists of two levels:
- the first level is ‘Number,’ and
- the second level is the category name (cat).
If a category column doesn’t exist, as determined in the previous if statement, this code below will initializes all its values to 0.
df_pivot[('Number', cat)] = 0: This line of code creates a new column with the name (Number, cat).
Accessing Data
I can imagine how difficult it is, to understand the code above for the first time. So I provided an example method to access data using index.
  def access_headers_and_column(self):
    # Access and print column headers (keys)
    column_headers = self.df_pivot.columns
    print("Column Headers:", column_headers)

    # Access and print a specific column,
    # for example, "Orange"
    orange_column = self.df_pivot[('Number', 'Orange')]
    print("Orange Column:")
    print(orange_column)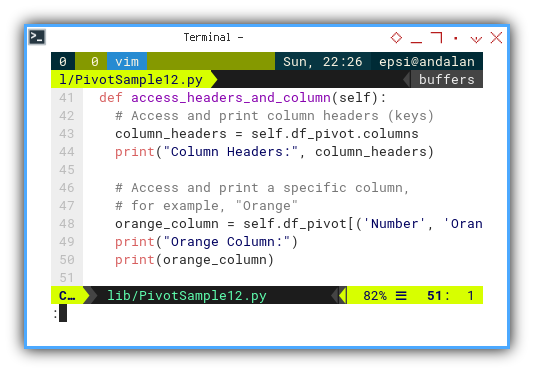
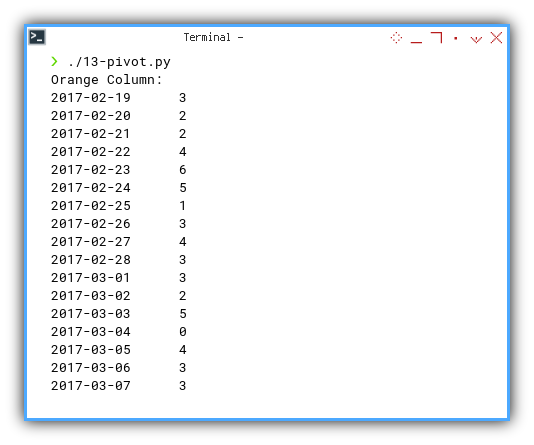
The result of the orange_column can be shown as below:
❯ ./13-pivot.py
Orange Column:
2017-02-19      3
2017-02-20      2
2017-02-21      2
2017-02-22      4
2017-02-23      6
2017-02-24      5
2017-02-25      1
2017-02-26      3
2017-02-27      4
2017-02-28      3
2017-03-01      3
2017-03-02      2
2017-03-03      5
2017-03-04      0
2017-03-05      4
2017-03-06      3
2017-03-07      3
You can experiment with your own index address.
Display Pivot
Nothing special here. Just separating view-related code.
  def display(self) -> None:
    # Display the pivot table
    print("Pivot Table:")
    print(self.df_pivot)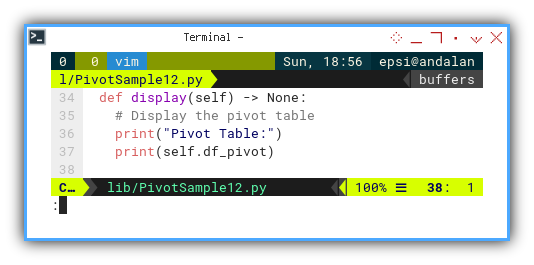
Terminal Result
The same as before.
We can run the script and obtain the result similar to below:
❯ ./12-model-view.py
Header: Index(['Number', 'Date', 'Fruit'], dtype='object')
Data:
     Number        Date       Fruit
0         1  19/02/2017      Orange
1         2  19/02/2017       Grape
2         3  19/02/2017  Strawberry
3         4  19/02/2017      Orange
4         5  19/02/2017       Apple
..      ...         ...         ...
750     751  05/04/2017  Strawberry
751     752  05/04/2017  Strawberry
752     753  05/04/2017       Mango
753     754  05/04/2017  Strawberry
754 755 05/04/2017 Banana[755 rows x 3 columns]
Pivot Table:
Number ... Category
Fruit Apple Banana ... Strawberry Total
2017-02-19 1 3 ... 4 15
2017-02-20 0 4 ... 2 10
2017-02-21 2 1 ... 3 16
2017-02-22 4 1 ... 5 16
2017-02-23 1 4 ... 3 22
... ... ... ... ... ...
2017-04-02 1 1 ... 1 17
2017-04-03 4 0 ... 5 18
2017-04-04 0 2 ... 3 11
2017-04-05 3 1 ... 4 13
Total 114 125 ... 126 755
[47 rows x 9 columns]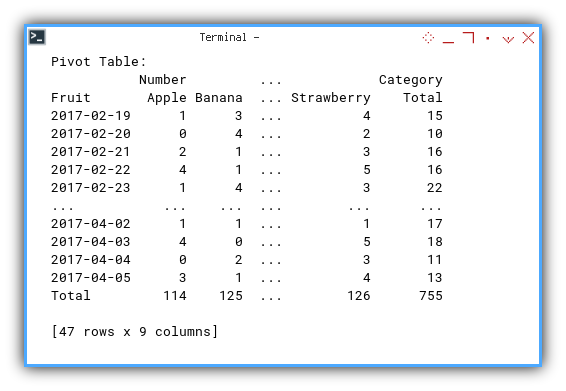
Why did I prepare that PivotSample class above?
Because I will add complexity to code below,
by adding a few methods.
Where Do We Go From Here 🤔?
Our journey doesn’t end here. We still have to add the total row and total column.
Consider continuing to read [ Pivot - Model - Total Dataframe ].