Preface
Goal: Start data modelling with well structured CSV reader class.
Now, let’s delve into data modeling. We’ll commence with complex list comprehension, unraveling cool tricks as we transform the data. Following that, we’ll transition to dataframes, a more user-friendly option that, nonetheless, demands a few tricks or, to be precise, careful reading of the official documentation. Both methods require a bit of time and effort to master.
Source Examples
You can access the source examples here:
Library
To start, all you need is the csv module. However, for convenience, I also make use of additional modules.
import csv
from typing import List
from pprint import pprint
Simple CSV Reader
Let’s begin with a simple sequence, just reading the CSV, row by row.
Class Diagram
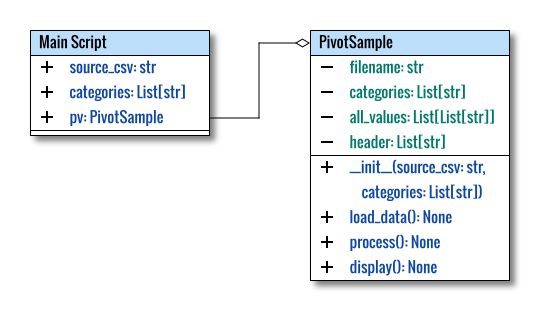
The class diagram, much like the code, is straightforward.
In standard class diagrams, the main part, which typically including the main function or script, is not explicitly represented. To better explain the entire code, let’s adjust this rule and show the main script as a class. This was done to offer a comprehensive illustration of the overall structure.

The class diagram above was created using a multiple-pages feature in Inkscape. The source can be obtained here, for your reference and customization.
On the browser, only the first image is displayed. You can use Inkscape to view more pages.
Script Skeleton
The script skeleton is as below:
import csv

class PivotSample:
  def __init__(self, filename: str) -> None:
    self.filename = filename

  def run(self) -> None:
    ...

def main() -> None:
  source_csv = 'sample-data.csv'

  pv = PivotSample(source_csv)
  pv.run()

if __name__ == "__main__":
  main()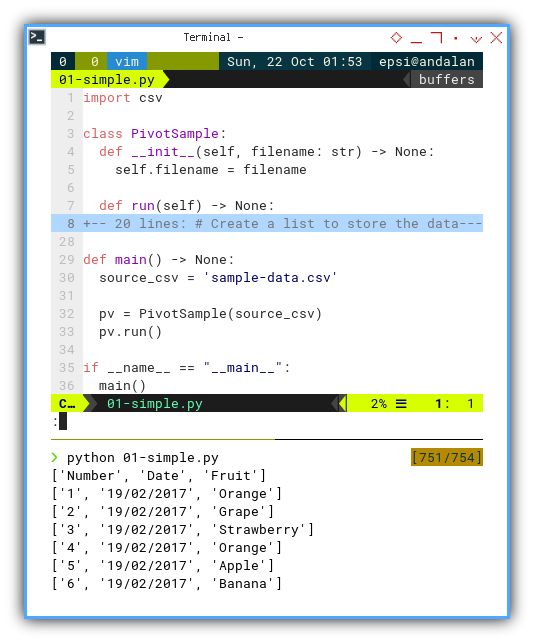
With the result being:
❯ python 01-simple.py
['Number', 'Date', 'Fruit']
['1', '19/02/2017', 'Orange']
['2', '19/02/2017', 'Grape']
['3', '19/02/2017', 'Strawberry']
['4', '19/02/2017', 'Orange']
['5', '19/02/2017', 'Apple']
['6', '19/02/2017', 'Banana']
['7', '19/02/2017', 'Strawberry']
['8', '19/02/2017', 'Banana']
['9', '19/02/2017', 'Strawberry']
['10', '19/02/2017', 'Mango']
['11', '19/02/2017', 'Banana']
['12', '19/02/2017', 'Grape']
['13', '19/02/2017', 'Orange']
['14', '19/02/2017', 'Mango']
['15', '19/02/2017', 'Strawberry']
['16', '20/02/2017', 'Orange']
['17', '20/02/2017', 'Mango']
['18', '20/02/2017', 'Banana']
['19', '20/02/2017', 'Mango']
['20', '20/02/2017', 'Strawberry']
The data format is a list of list(s).
How does it works?
It is all in the run method,
and I think it is pretty explanatory.
  def run(self) -> None:
    # Create a list to store the data
    all_values = []

    # Read the data from the CSV file
    with open(self.filename,
        mode='r', newline='') as file:

      reader = csv.reader(file)

      # Read the header
      header = next(reader)
      for row in reader:
        all_values.append(row)

    # Display the header
    print(header)

    # Display the data
    for row in all_values:
      print(row)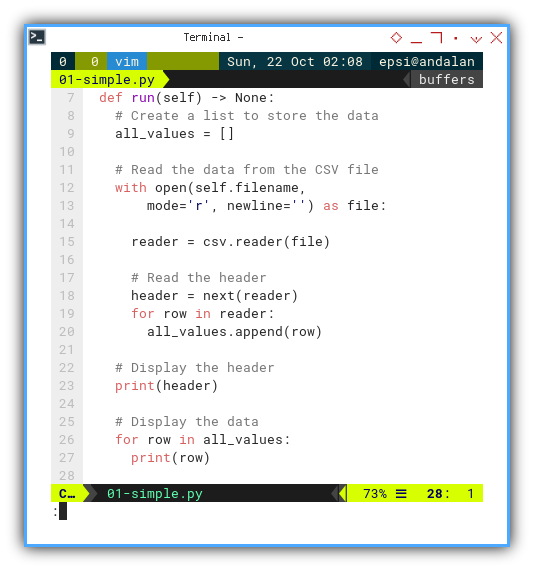
We can trap any error in `try-except``, to make the error messages more user-friendly:
  def run(self) -> None:
    try:
      all_values = []
      ...

    except FileNotFoundError:
      print("Error: The file "
        + f"'{self.filename}' was not found.")
    except Exception as e:
      print(f"An error occurred: {e}")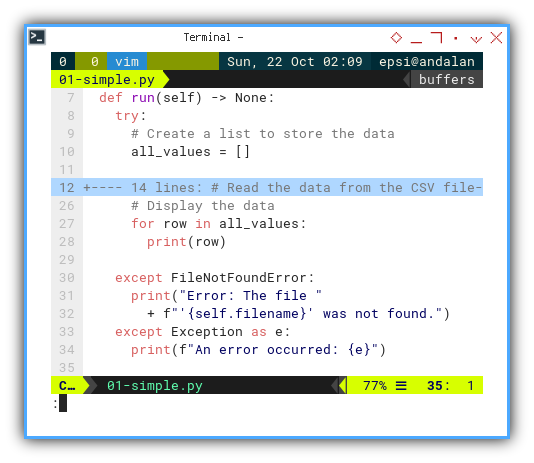
This covers the very basic part of the code. Now, let’s proceed to process the data.
Model View
It’s a good practice to separate the data model and the output display. This separation allows us to have one model but multiple views. In this case, we can have one pivot table, and then choose to display the data representation, such as:
- in the terminal console,
- export it to an XLSX file using openPyXl, or
- render the cells one by one using LibreOffice Macro.
Class Skeleton
The class skeleton is as below:
class PivotSample:
  def __init__(self, source_csv: str,
      categories: List[str]) -> None:
    ...

  def load_data(self) -> None:
    ...

  def display(self) -> None:
    ...

  def process(self):
    self.header = None
    self.load_data()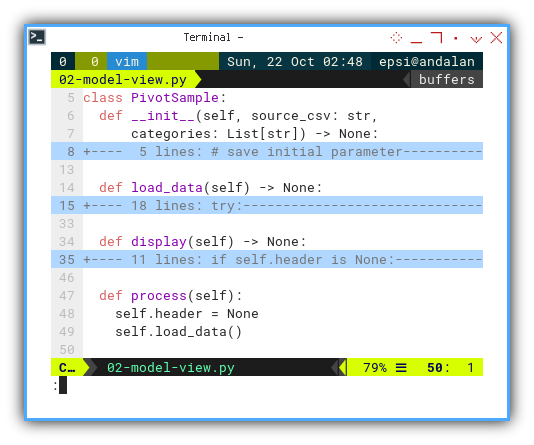
Main Program
We need to add category definitions. Then we can call the above class in the main program as follows:
def main() -> None:
  source_csv = 'sample-data.csv'
  categories = [
    "Apple", "Banana", "Dragon Fruit",
    "Durian", "Grape", "Mango",
    "Orange", "Strawberry"]

  pv = PivotSample(source_csv, categories)
  pv.process()
  pv.display()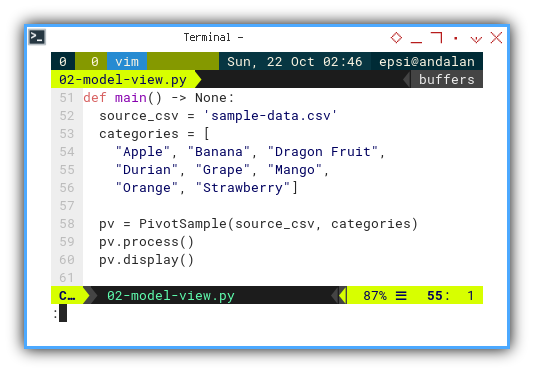
Initialization
Following a popular OOPs approach, we should prepare variable initialization, when creating an object instance.
class PivotSample:
  def __init__(self, source_csv: str,
      categories: List[str]) -> None:

    # save initial parameter
    self.filename = source_csv
    self.categories = categories
    self.all_values = []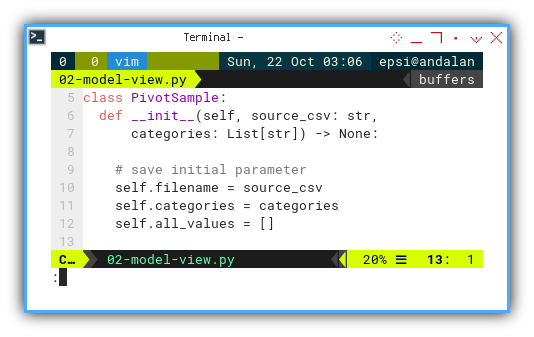
I also add the data type on each parameter argument, so I won’t confuse myself when reading my own code years later.
Loading Data
The code inside load_data method is,
similar the same with the previous run method,
without the displaying part.
  def load_data(self) -> None:
    try:
      with open(self.filename,
          mode='r', newline='') as file:

        reader = csv.reader(file)

        # Read the header
        self.header = next(reader)

        # retrieving all rows data
        for row in reader:
          self.all_values.append(row)

    except FileNotFoundError:
      print("Error: The file "
        + f"'{self.filename}' was not found.")
    except Exception as e:
      print(f"An error occurred: {e}")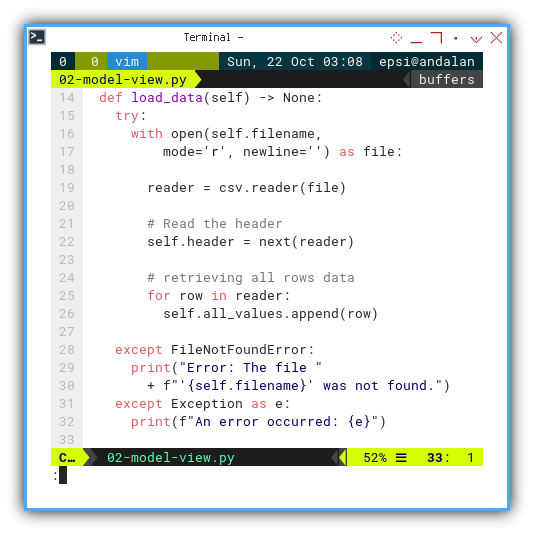
Display
I moved all the display part here:
  def display(self) -> None:
    if self.header is None:
      print("No data to display.")
    else:
      # Display the header
      # ['Number', 'Date', 'Fruit']
      print(self.header)

      # Display the data
      # ['1', '19/02/2017', 'Orange']
      for row in self.all_values:
        print(row)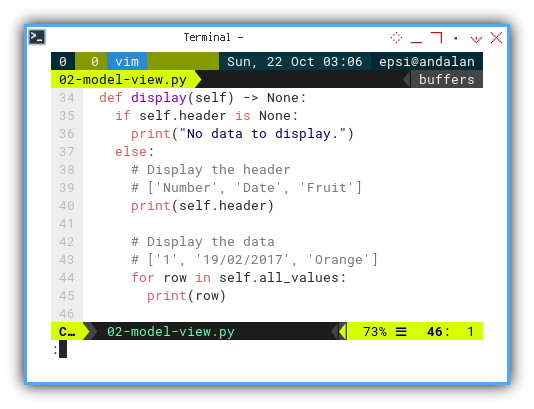
List comprehension can be complex. Before we begin, I would like to keep a habit, of documenting the example result in a comment.
Process
Instead of using run,
I prefer to use process,
because what we are doing is just processing data,
without displaying any.
  def process(self):
    self.header = None
    self.load_data()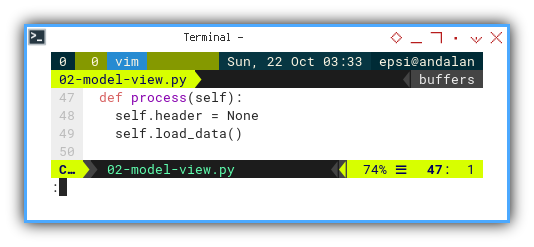
Note that we do not put
the display method here in process method.
The display method is optional.
We can call the display method
from the main function using the class instance.
  pv = PivotSample(source_csv, categories)
  pv.process()
  pv.display()
Result
The result is exactly the same as previous. However this time, the script structure is scalable.
❯ python 02-model-view.py
['Number', 'Date', 'Fruit']
['1', '19/02/2017', 'Orange']
['2', '19/02/2017', 'Grape']
['3', '19/02/2017', 'Strawberry']
['4', '19/02/2017', 'Orange']
['5', '19/02/2017', 'Apple']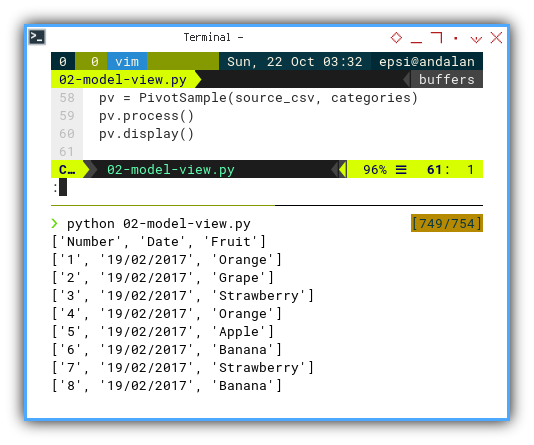
We are done with the CSV reader.
What Lies Ahead 🤔?
We can dive right away, having fun with list comprehension, learning cool tricks while transforming data. We will explore how the data evolves from a table to a pivot.
Consider continuing to read [ Pivot - Model - List Comprehension ].