Preface
Goal: Reading a predefined sheet to a plain dataframe, and and build pivot dataframe.
In this section, we embark on the journey of building a pivot with a Python macro in LibreOffice. This approach provides you with a readily applicable template for common office scenarios.
As part of our well-structured learning process, we’ll commence the LibreOffice Python macro tutorial by focusing on the creation of a straightforward spreadsheet table.
Reading
Understanding the code snippets below will necessitate a careful examination of the LibreOffice API.
Source
Our data source for this exercise is a simple worksheet table:
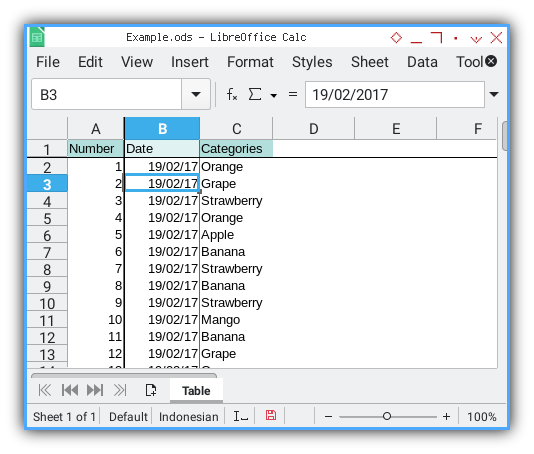
This table comprises three columns: A, B, and C, adorned with uncomplicated decoration.
Preview
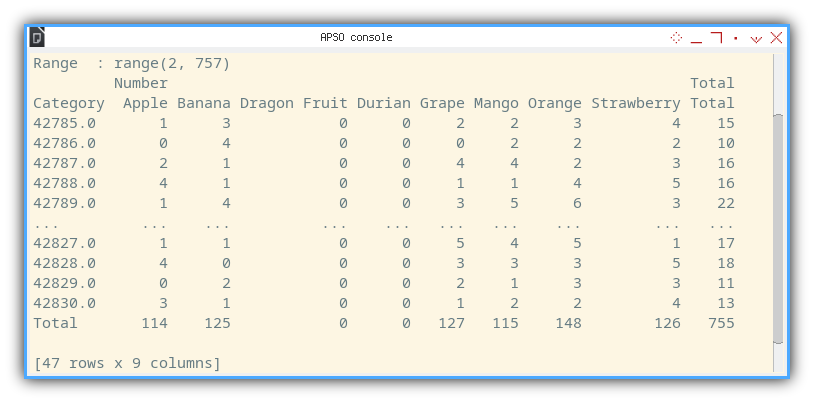
The terminal display below represents the envisioned DataFrame we aim to generate:
Source Examples
Explore the source examples available for reference:
Reader: Main Macro
For this task, we will utilize our existing Example.ods
file and read data from the Table worksheet.
Class(es) in Macro
Within the internal structure of the LibreOffice macro, the class is encapsulated within the macro itself. While in more sophisticated scenarios, one might consider relocating the class into a custom library, debugging could be challenging due to caching issues.
In my system, the Pivot file is stored in this directory.
/home/epsi/.config/libreoffice/4/user/Scripts/python/PivotIn summary, all classes are stored within one macro, eliminating the need for local libraries.
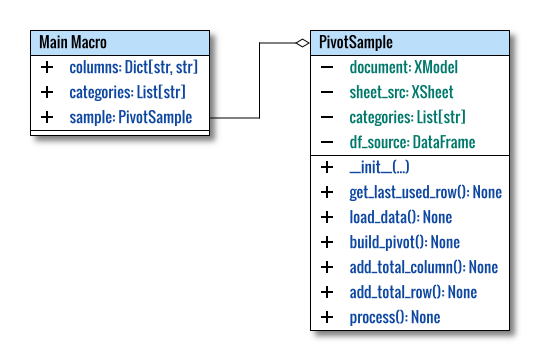
Class Diagram
To provide a comprehensive illustration of the overall structure, the main macro is represented in a class diagram. Although this isn’t a standard UML representation, adjustments have been made for clarity. We’ll start with a simple diagram.
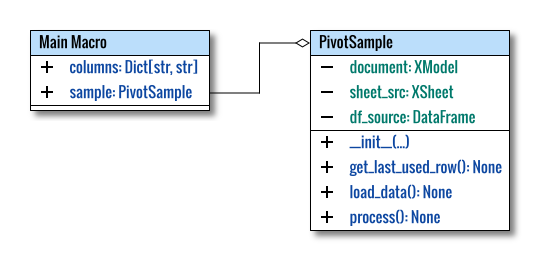
The class diagram above is created using multiple pages in Inkscape. The source can be obtained here, allowing you to adapt it for your own purposes.
For simplicity, I intentionally use XModel in the diagram,
while the actual type is SpreadsheetDocument.
The same applies to the sheet,
where we use XSheet in the diagram,
while the actual type is Spreadsheet.
We will refine the types further
in the UNO (Universal Network Objects) part
of this article series.
Libraries
The only external library needed is pandas.
The rest are optional.
import pandas as pd

from pprint import pprint
from typing import Dict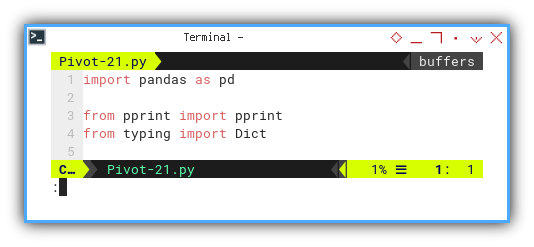
The XSCRIPTCONTEXT is already handled by LibreOffice.
Macro Skeleton
Here’s how the macro skeleton looks:
class PivotSample:
  ...

def main() -> None:
  ...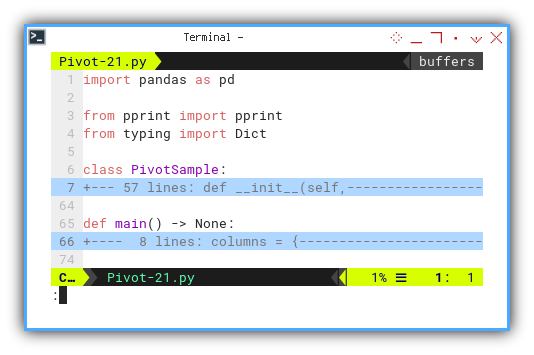
Note that there is no equivalent to __main__ in a macro.
The execution begins with the main method.
Main Method
The first part is custom variable, also categories to be used as feed for class initialization.
def main() -> None:
  columns = {
    'index' : 'A',
    'date'  : 'B',
    'cat'   : 'C'
  }

  sample = PivotSample('Table', columns)
  sample.process()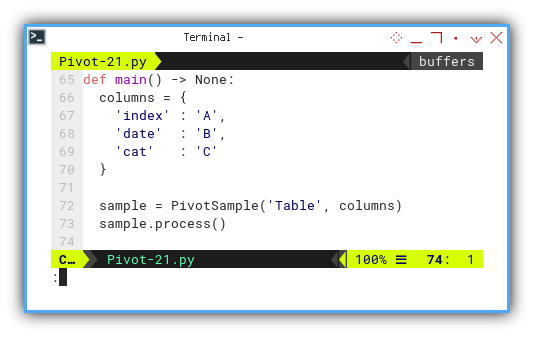
We have defined the column that we are going to use: A, B, C.
Table Reader Class
This macro essentially consists of a loop that iterates through a range of rows in a worksheet, concatenating the values into a DataFrame.
With the ability to read and write into worksheets, your basic macro skills are sufficient, for straightforward data processing. You can play around with any bulk of worksheet data.
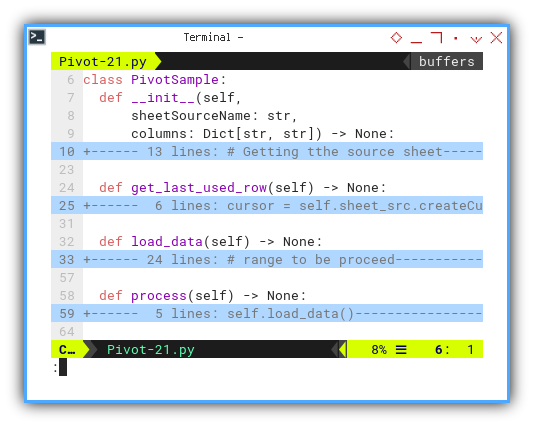
Class Skeleton
Here’s how the skeleton looks:
class PivotSample:
  def __init__(self,
      sheetSourceName: str,
      columns: Dict[str, str]) -> None:

    ...

  def get_last_used_row(self) -> None:
    ...
  def load_data(self) -> None:
    ...

  def process(self) -> None:
    ...
XSCRIPTCONTEXT
The root of all interfaces is XSCRIPTCONTEXT.
From this point, you can trace all the interfaces
and services required in this example.
Further details about this interface can be found here.
Initialization
There are two parameter arguments here.
- First is the data source.
- Second is the columns for mapping the data.
And this XSCRIPTCONTEXT is crucial
in LibreOffice macro development,
especially for beginners.
class PivotSample:
  def __init__(self,
      sheetSourceName: str,
      columns: Dict[str, str]) -> None:

    # Getting tthe source sheet
    document = XSCRIPTCONTEXT.getDocument()
    self.sheet_src = document.Sheets[sheetSourceName]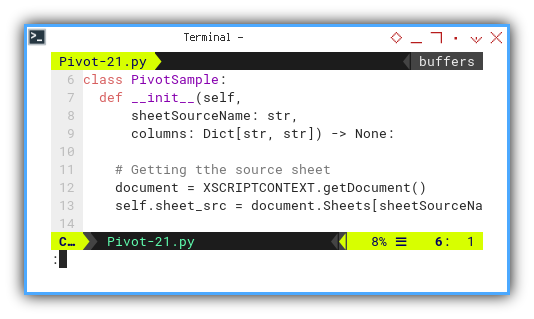
We can unpack the mapping column to self as usual.
    # Unpack the dictionary keys and values
    # into class attributes
    for key, value in columns.items():
      setattr(self, f"col_{key}", value)
And also initialize dataframe.
    # initialize dataframe
    self.df_source = pd.DataFrame({
      "Number": [], "Date": [], "Category": [] })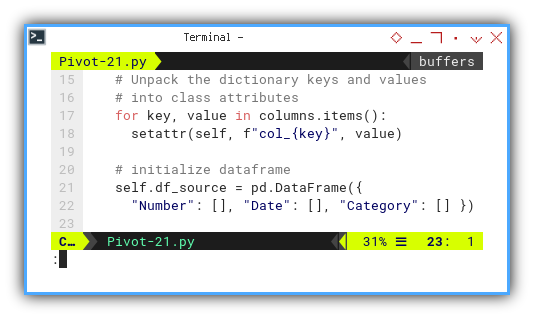
Now, we can use the DataFrame based on the predefined list above.
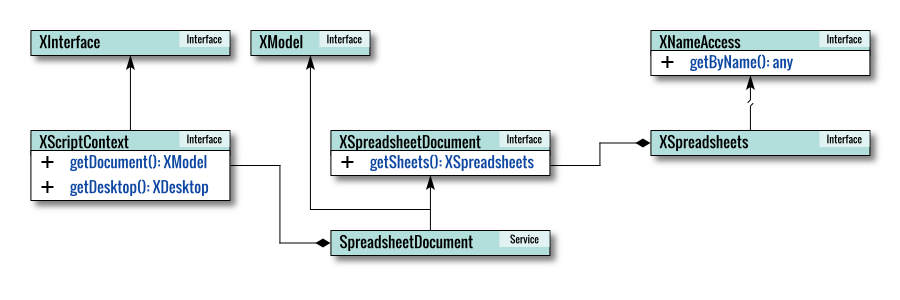
LibreOffice API
While coding a LibreOffice Macro, I often refer to the API documentation, going back and forth between page until I can grasp what I need. For example, a seemingly cumbersome task like obtaining a sheet can be simplified as shown below. Though it may take some effort to understand, once the code works, you can reuse it for multiple projects. Understanding the official API is, more reliable than repeatedly searching on Stack Overflow.
Let’s take an example of getting a sheet. The longer form of the above method is:
    # Getting the source sheet
    document = XSCRIPTCONTEXT.getDocument()
    self.sheet_src = document.getSheets().getByName(sheetSourceName)
Getting the sheet can be expressed in a shorter form:
self.sheet_src = document.Sheets[sheetSourceName]From api.libreoffice.org, I can found the type.
getDocument() return: XModel
in this case is SpreadsheetDocument that is descendant of XModel.
SpreadsheetDocument itself is descendant of XSpreadsheetDocument.
XSpreadsheetDocument has method getSheets() method that return XSpreadsheets.
XSpreadsheets is descendant of XNameContainer which is descendant of XNameReplace which is descendant of XNameAccess.
XNameAccess has method getByName() with return of any. In this case the return type is supposed to be Spreadsheet as expected.
Spreadsheet is descendant of XSpreadsheet.
Confused yet? This is why I love diagram.
Internal Diagram
To enhance your understanding of the internal workings of the LibreOffice API, let’s document the services, interfaces, and methods used in this macro and then visualize the class diagram. As usual, this is a conceptual diagram that requires clarity, so I won’t strictly adhere to the standard UML diagram.
The class diagram above was created using the multi-page Inkscape feature. The source can be obtained here, allowing you to modify it for your own purposes.
Service and Interface
In the context of the LibreOffice API and UNO (Universal Network Objects), the relationship between a service and an interface is more akin to an implementation relationship rather than a direct inheritance relationship.
When you have a Spreadsheet Service,
it typically means that you have an instance of a component,
or service that provides the functionality of a spreadsheet document.
In this case, the service is an implementation of
the com.sun.star.sheet.SpreadsheetDocument service.
On the other hand, XSpreadsheet is an interface.
An interface defines a set of methods that an object can implement.
The com.sun.star.sheet.XSpreadsheet interface, in particular,
defines methods related to working with a spreadsheet.
So, in a sense, a spreadsheet document service is not,
a descendant of XSpreadsheet interface in a classical inheritance sense,
but an instance of a service can implement
or support the functionality defined by XSpreadsheet.
In summary, a service provides a certain functionality, and an interface defines a set of methods. Instances of a service can implement or support one or more interfaces, allowing them to expose specific functionality defined by those interfaces.
Getting The Actual Sheet.
Now the question, with the return of getByName() is as any type,
how come that the actual return is as Spreadsheet type?
Here, getSheets() returns an object of type XSpreadsheets,
and the subsequent getByName(sheetSourceName) call
retrieves a specific sheet with the given name (sheetSourceName).
The getByName() method is designed to work with a predefined type,
and in this context, it returns an object of type Spreadsheet.
Even though the return type of getByName() is
specified as any in the interface hierarchy,
the actual implementation ensures that the returned object is
of the expected type (Spreadsheet in this case).
Maximum Used Row
Moving from concepts to actual code, let’s focus on obtaining the row length.
Fortunately, LibreOffice allows us to count the used rows, eliminating the need to find the table length manually. We can set a predefined range as a basis for our loop.
  def get_last_used_row(self) -> None:
    cursor = self.sheet_src.createCursor()
    cursor.gotoEndOfUsedArea(False)
    cursor.gotoStartOfUsedArea(True)
    rows = cursor.getRows()

    return len(rows)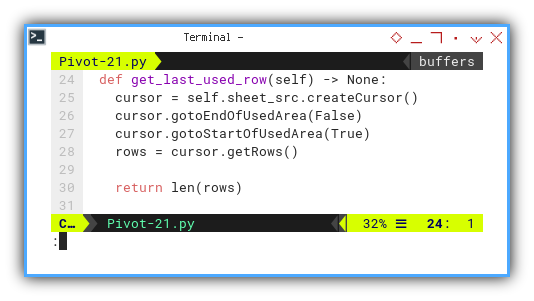
Loading Data
This function further streamlines the process by removing the manual search for table length. We create a predefined range as a basis for our loop.
  def load_data(self) -> None:
    # range to be proceed
    # omit header and plus one for the last
    max_row = self.get_last_used_row()
    range_rows = range(2, max_row+1)

    print(f'Range  : {range_rows}')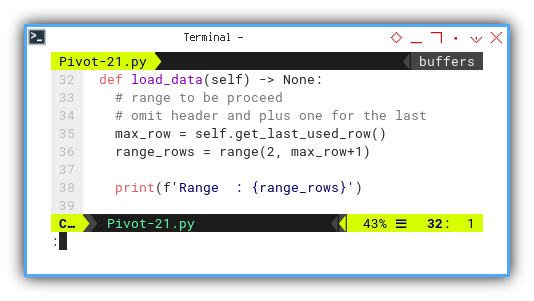
Using this loop, we traverse each row of the worksheet, extracting three values to form a new dataframe.
    for row in range_rows:
      # Convert the new data to a DataFrame
      new_row = pd.DataFrame({
        "Number"   : int(self.sheet_src[
            f'{self.col_index}{row}'].Value),
        "Date"     : int(self.sheet_src[
            f'{self.col_date}{row}'].Value),
        "Category" : self.sheet_src[
            f'{self.col_cat}{row}'].String
      }, index=[0])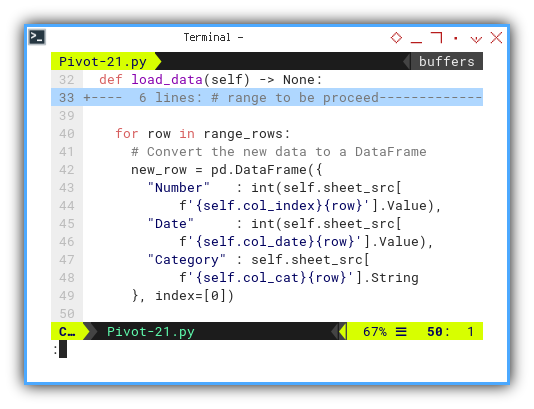
We then concatenate each row, appending it to the dataframe.
      # Append the new row to the existing DataFrame
      self.df_source = pd.concat(
        [self.df_source, new_row], ignore_index=True)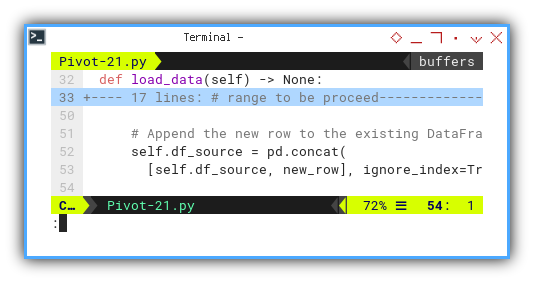
Voila… magic happens.
Behind The Scene
Internal Diagram
This diagram illustrates how the service and interface components come together to work with the Cell object.
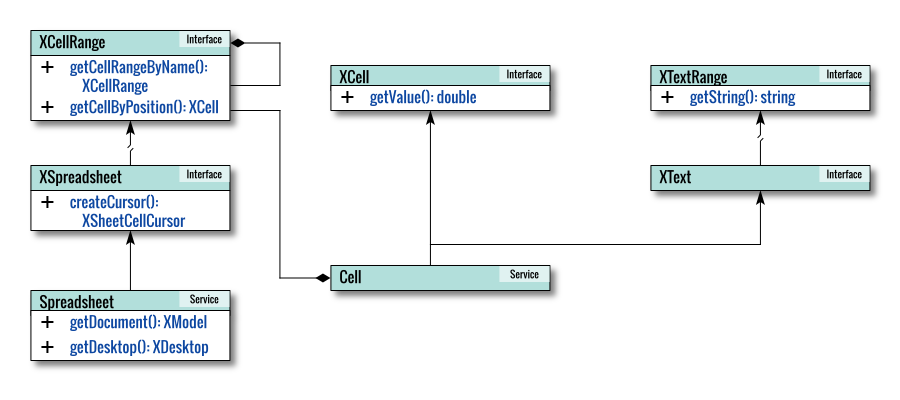
Let’s consider an example: retrieving the value. The longer form of the method is as follows.
int(self.sheet_src.getCellRangeByName(
    f'{self.col_index}{row}').getCellByPosition(0,0).getValue()),
This can be simplified to a shorter form.
int(self.sheet_src[
   f'{self.col_index}{row}'].Value),
Obtaining the string is somewhat more complex. The longer form of the method is as follows.
self.sheet_src[
    f'{self.col_cat}{row}'].getText().getString()
Alternatively, using a property instead of a getter.
self.sheet_src[
    f'{self.col_cat}{row}'].Text.String
Retrieving the string can be further simplified.
self.sheet_src[
            f'{self.col_cat}{row}'].String
Process
The flow of the class is straightforward.
  def process(self) -> None:
    self.load_data()

    # Print the updated DataFrame
    print(self.df_source)
    print()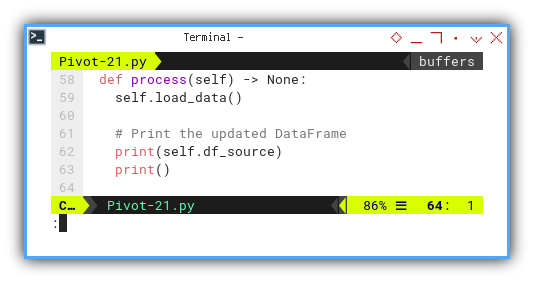
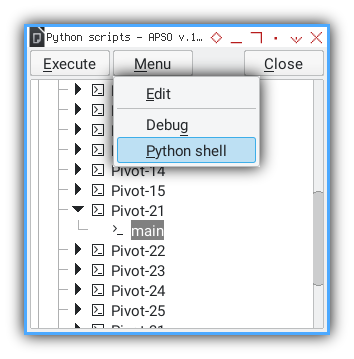
Running Macro in Calc
To execute a Python macro in LibreOffice Calc, you can use APSO:
Result Preview
Run the macro in the terminal, and you’ll see a text output similar to the one below:
>>> main()
Range  : range(2, 757)
     Number     Date    Category
0       1.0  42785.0      Orange
1       2.0  42785.0       Grape
2       3.0  42785.0  Strawberry
3       4.0  42785.0      Orange
4       5.0  42785.0       Apple
..      ...      ...         ...
750   751.0  42830.0  Strawberry
751   752.0  42830.0  Strawberry
752   753.0  42830.0       Mango
753   754.0  42830.0  Strawberry
754   755.0  42830.0      Banana

[755 rows x 3 columns]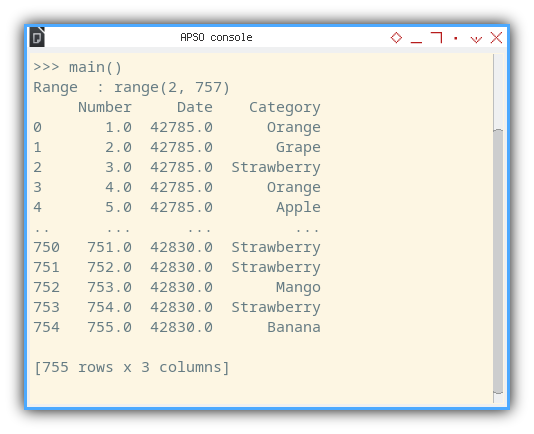
As you can observe, the dates are stored as integer values.
Pivot Dataframe: Main Macro
After obtaining the dataframe result, the next step is to transform it into a pivot dataframe.
Class Diagram
Advancing from the simple diagram, we can continue building the pivot and visualize the result at startup.
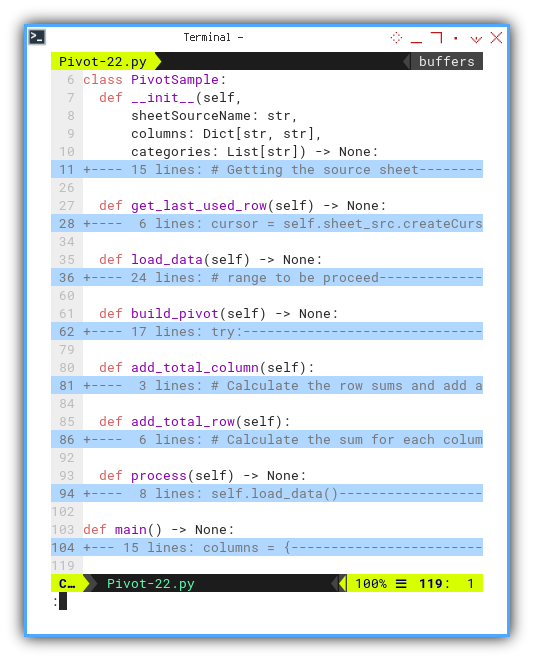
Macro Skeleton
Here is the structure of the macro:
class PivotSample:
  def __init__(self,
      sheetSourceName: str,
      columns: Dict[str, str],
      categories: List[str]) -> None:
    ...

  def get_last_used_row(self) -> None:
    ...

  def load_data(self) -> None:
    ...

  def build_pivot(self) -> None:
    ...

  def add_total_column(self):
  ...

  def add_total_row(self):
    ...

  def process(self) -> None:
    ...

def main() -> None:
  ...
Main Method
Similar to the previous one, with the addition of categories.
def main() -> None:
  columns = {
    'index' : 'A',
    'date'  : 'B',
    'cat'   : 'C'
  }

  categories = [
    "Apple", "Banana", "Dragon Fruit",
    "Durian", "Grape", "Mango",
    "Orange", "Strawberry"]

  pd.set_option('display.max_rows', 10)

  sample = PivotSample('Table', columns, categories)
  sample.process()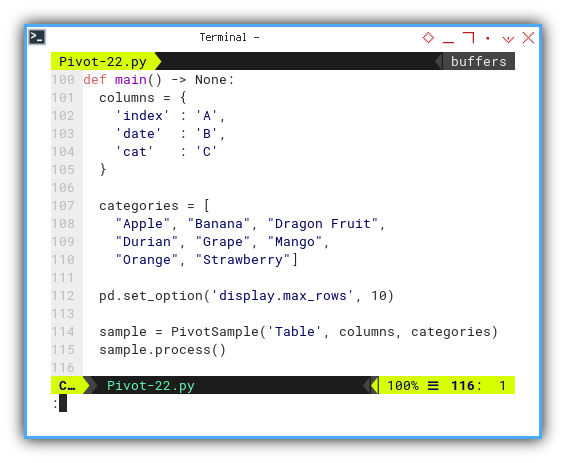
The category lookup serves
as a reference value for the C column.
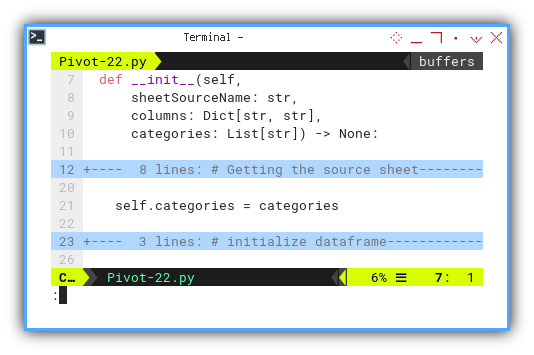
Initialization
The only difference lies in the initial setup of categories.
class PivotSample:
  def __init__(self,
      sheetSourceName: str,
      columns: Dict[str, str],
      categories: List[str]) -> None:

    # Getting the source sheet
    ...

    self.categories = categories

    # initialize dataframe
    ...
Building Pivot
We can now proceed to building the pivot. The details have already been explained in the previous dataframe example.
  def build_pivot(self) -> None:
    try:
      # Perform pivot operations
      self.pivot_table = self.df_source.pivot_table(
        index='Date', columns='Category',
        aggfunc='count', fill_value=0)

      # Ensure all specified columns are present
      for cat in self.categories:
        if ('Number', cat) not in self.pivot_table.columns:
          self.pivot_table[('Number', cat)] = 0

      # Sort the columns (fruits) in alphabetical order
      self.pivot_table = self.pivot_table.sort_index(axis=1)

    except Exception as e:
      print("An error occurred " \
        + f"while processing data: {e}")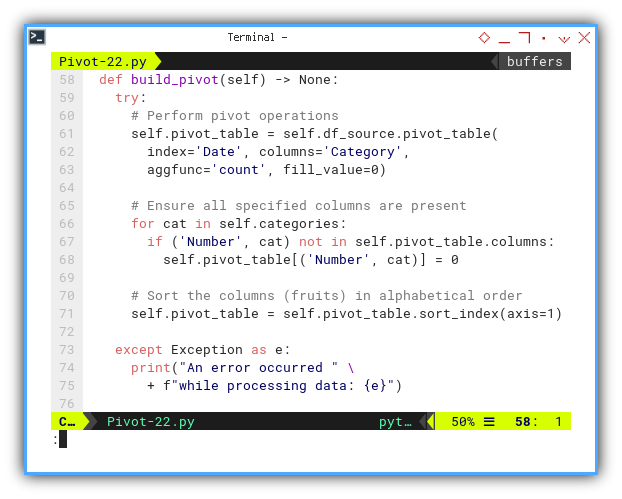
Adding Total
Similar to the previous example, we can add both total columns and rows.
Total Column
  def add_total_column(self):
    # Calculate the row sums and add a total column
    row_sums = self.pivot_table.sum(axis=1)
    self.pivot_table[('Total Date', 'Total')] = row_sums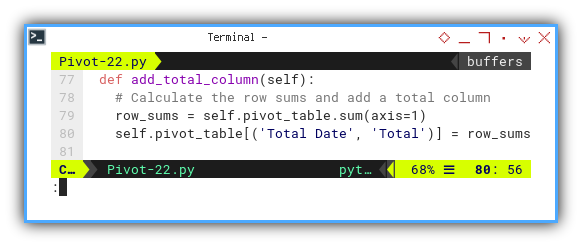
Total Row
  def add_total_row(self):
    # Calculate the sum for each column
    # and add a total row
    total_row = self.pivot_table.sum().to_frame().T
    total_row.index = ['Total']
    self.pivot_table = pd.concat(
      [self.pivot_table, total_row])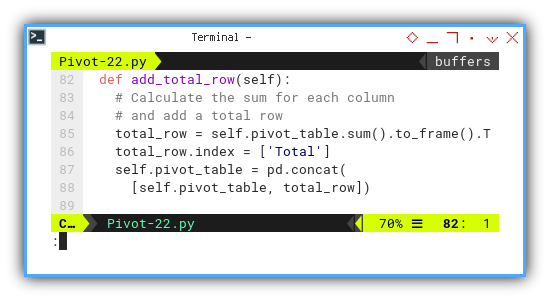
Process
Gathering All Together
Now, we can consolidate all the dataframe creation steps into a single process method.
  def process(self) -> None:
    self.load_data()
    self.build_pivot()
    self.add_total_column()
    self.add_total_row()

    # Print the newly created pivot table
    print(self.pivot_table)
    print()
Result Preview
You can run the Python macro in LibreOffice Calc using APSO and view the result in the APSO terminal as shown below:
>>> main()
Range  : range(2, 757)
         Number                                                          Total
Category  Apple Banana Dragon Fruit Durian Grape Mango Orange Strawberry Total
42785.0       1      3            0      0     2     2      3          4    15
42786.0       0      4            0      0     0     2      2          2    10
42787.0       2      1            0      0     4     4      2          3    16
42788.0       4      1            0      0     1     1      4          5    16
42789.0       1      4            0      0     3     5      6          3    22
...         ...    ...          ...    ...   ...   ...    ...        ...   ...
42827.0       1      1            0      0     5     4      5          1    17
42828.0       4      0            0      0     3     3      3          5    18
42829.0       0      2            0      0     2     1      3          3    11
42830.0       3      1            0      0     1     2      2          4    13
Total       114    125            0      0   127   115    148        126   755

[47 rows x 9 columns]
Now is an opportune time to write the result into its dedicated worksheet.
What Comes Next 🤔?
Our journey begins with the initial task of reading the table. Following this, the subsequent step involves constructing the pivot dataframe. These actions collectively contribute to the creation of a LibreOffice pivot using a Python macro.
After successfully reading the data, the next steps involve writing the pivot dataframe into a designated sheet and adding aesthetic embellishments to enhance the overall presentation of the worksheet.
Consider progressing further by exploring the next topic: [ Pivot - Calc Macro - Pivot Writer ].