Preface
Goal: Transform data with list comprehension, from plain table to pivot.
In this article, we will explore how the data evolves from a table to a pivot. We’ll have fun with list comprehension and learn cool tricks while transforming data.
Building Pivot
After reading the CSV, row by row,
we can build model using build_pivot(),
by calculating the pivot manually.
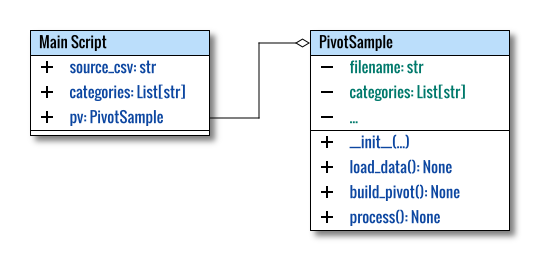
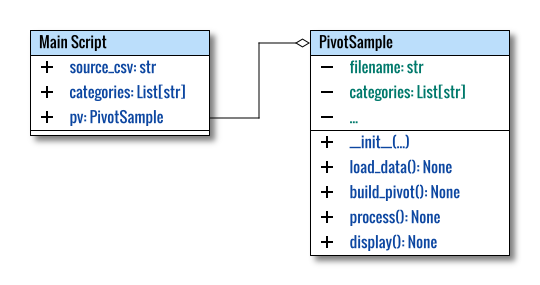
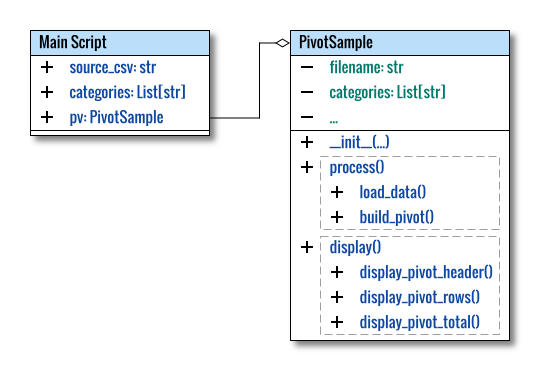
I’ve simplified the diagram for better understanding.
Main Program
The main program remains intact, exactly the same as before.
Class Skeleton
The class skeleton is as follows:
class PivotSample:
  def __init__(self, source_csv: str,
      categories: List[str]) -> None:
    ...

  def load_data(self) -> None:
    ...

  def build_pivot(self) -> None:
    ...

  def display(self) -> None:
    ...

  def process(self):
    self.header = None
    self.load_data()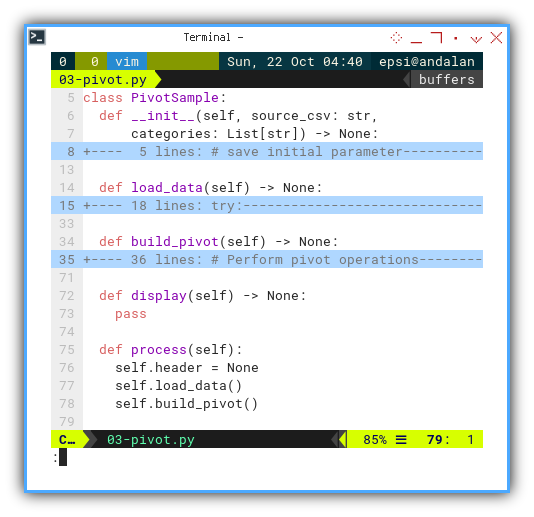
Instead of returning a value, in OOP, we can store the value in a property.
Process
We are going to add build_pivot() method here:
  def process(self):
    self.header = None
    self.load_data()
    self.build_pivot()
Build Pivot
This is our main part. Let’s go through this step by step.
Transformation Abstraction
Consider making a plan without ever writing a single line of code. Write down how the data transforms.
Raw Data
Imagine how to get the pivot using set theory.
Denote the raw data as a set Raw Data,
where each element is a triple:
For example:
Number,Date,Fruit
1,19/02/2017,Orange
2,19/02/2017,Grape
3,19/02/2017,Strawberry
4,19/02/2017,Orange
5,19/02/2017,Apple
Overall Process
Express the overall process in a single mathematical expression. Note that this expression would be more symbolic and conceptual, rather than an actual operation.
This expression uses the set union symbol (∪) to add the zero count for categories not found on a particular date.
Actual Process
The actual operations involve several steps. Let’s break down the operations.
- Grouping by Date:
For example:
'01/03/2017': ['Strawberry',
                'Strawberry',
                'Grape',
                'Grape',
                'Banana',
                'Apple',
                'Orange',
                'Orange',
                'Banana',
                'Grape',
                'Banana',
                'Strawberry',
                'Orange',
'Strawberry'],- Counting Occurrences:
The result of above example is:
{'01/03/2017': {'Apple': 1,
                'Banana': 3,
                'Grape': 3,
                'Orange': 3,
                'Strawberry': 4},
 '01/04/2017': {'Apple': 4,
                'Banana': 6,
                'Grape': 2,
                'Mango': 2,
                'Orange': 3,
'Strawberry': 4},- Ensuring All Categories with Zero Counts:
The data required to for each pivot row are:
{'01/03/2017': {'Apple': 1,
                'Banana': 3,
                'Grape': 3,
                'Orange': 3,
                'Strawberry': 4},
 '01/04/2017': {'Apple': 4,
                'Banana': 6,
                'Grape': 2,
                'Mango': 2,
                'Orange': 3,
                'Strawberry': 4},
Now we are ready for the actual code.
Data Transformation
Let’s backtrack for a while:
CSV File
The original CSV file have a format as below
Number,Date,Fruit
1,19/02/2017,Orange
2,19/02/2017,Grape
3,19/02/2017,Strawberry
4,19/02/2017,Orange
5,19/02/2017,Apple
All Values: CSV Reader Result
As a result of the CSV reader,
we have a self.all_values variable.
This memory data can be shown in this List of List(s):
❯ python 02-model-view.py
['Number', 'Date', 'Fruit']
['1', '19/02/2017', 'Orange']
['2', '19/02/2017', 'Grape']
['3', '19/02/2017', 'Strawberry']
['4', '19/02/2017', 'Orange']
['5', '19/02/2017', 'Apple']
This is our first transformation.
All Dates: Grouping Category
I need to group the result by date, keeping the date as index for further use. This means we are the number index, will be disposed.
In order to group by date, we can use list comprehension in below:
  def build_pivot(self) -> None:
    self.all_dates = {
      row[1]: [item[2]
      for item in self.all_values
      if item[1] == row[1]]
        for row in self.all_values
    }

    pprint(self.all_dates)
This is basically a loop in a loop,
comparing all_values item.
The first loop is iterating all values,
while the second loop will append the category,
only if the date matches.
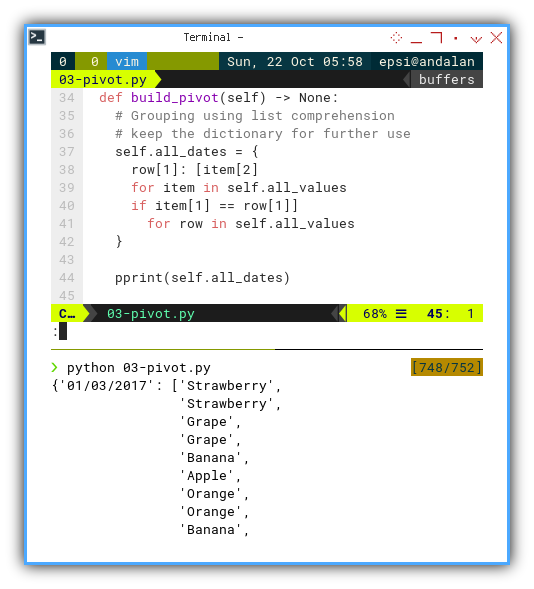
The result would looks like below:
'01/03/2017': ['Strawberry',
                'Strawberry',
                'Grape',
                'Grape',
                'Banana',
                'Apple',
                'Orange',
                'Orange',
                'Banana',
                'Grape',
                'Banana',
                'Strawberry',
                'Orange',
                'Strawberry'],
Occurences: Category Count
I need to count the distinct category for each group.
Counting occurrences can be done, by breaking row into an array of distinct category value. This can be done with list comprehension below:
    self.occurrences = {
      date: {cat: row.count(cat) for cat in set(row)}
      for date, row in self.all_dates.items()
    }

    pprint(self.occurrences)
The list comprehension is pretty self explanatory. The first loop is iterating all dates,
for date, row in self.all_dates.items()The second one is getting the count of distinct category.
Distinct category can be obtained by using set.
The count work for specific category in row (list of values).
{cat: row.count(cat) for cat in set(row)}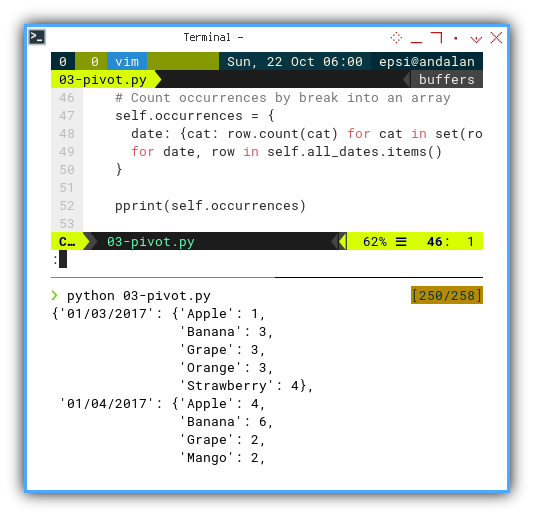
The result would looks like below:
{'01/03/2017': {'Apple': 1,
                'Banana': 3,
                'Grape': 3,
                'Orange': 3,
                'Strawberry': 4},
 '01/04/2017': {'Apple': 4,
                'Banana': 6,
                'Grape': 2,
                'Mango': 2,
                'Orange': 3,
                'Strawberry': 4},
Ensure Occurences: Respect Zero Count
I need to simulate Excel feature, showing a category that does not exist in original table.
Ensuring occurrences can be done, by creating a new dictionary with all class values and their counts, even zero count if category not found. This can be done with list comprehension below:
    self.ensure_occurrences = {
      date: {
        cat: pairs.get(cat, 0)
        for cat in self.categories
      }
      for date, pairs in self.occurrences.items()}

    pprint(self.ensure_occurrences)
The list comprehension is pretty self explanatory. The first loop is iterating all occurrences, and getting the default value as zero if category not found.
cat: pairs.get(cat, 0)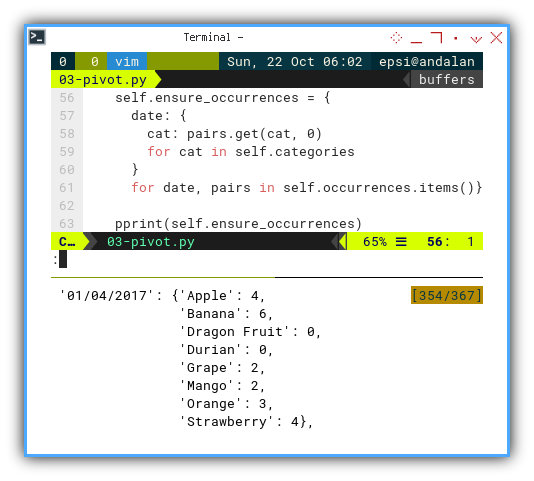
The result would looks like below:
{'01/03/2017': {'Apple': 1,
                'Banana': 3,
                'Dragon Fruit': 0,
                'Durian': 0,
                'Grape': 3,
                'Mango': 0,
                'Orange': 3,
                'Strawberry': 4},
 '01/04/2017': {'Apple': 4,
                'Banana': 6,
                'Dragon Fruit': 0,
                'Durian': 0,
                'Grape': 2,
                'Mango': 2,
                'Orange': 3,
                'Strawberry': 4},
Displaying Pivot
Moving from the model,
let’s shift our focus to the view
by expanding the display() method.
Main Program
The main program remains intact. No changes have been made.
Class Skeleton
The class skeleton is as below:
class PivotSample:
  def __init__(self, source_csv: str,
      categories: List[str]) -> None:
    ...

  def load_data(self) -> None:
    ...

  def build_pivot(self) -> None:
    ...

  def process(self):
    ...

  def display_basic(self) -> None:
    ...

  def display_process(self) -> None:
    ...

  def display_pivot_header(self) -> None:
    ...

  def display_pivot_rows(self) -> None:
    ...

  def display(self) -> None:
    ...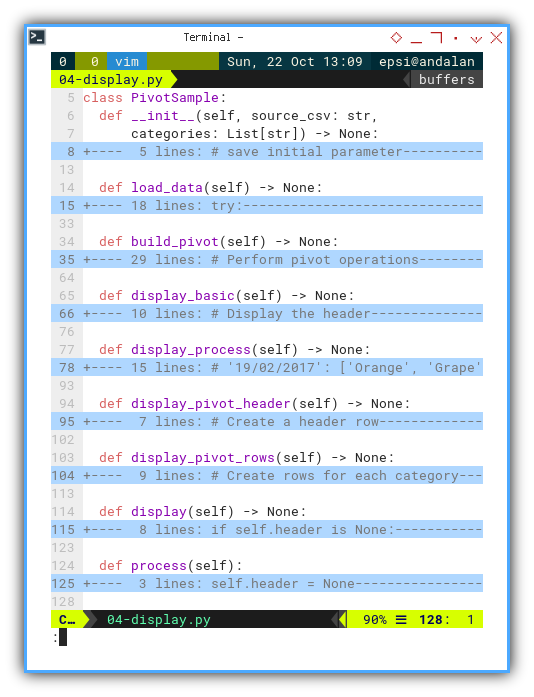
We have some additional display method.
Process
The main process is still intact. No changes have been made.
  def process(self):
    self.header = None
    self.load_data()
    self.build_pivot()
Build Pivot
This is where the list comprehension perform pivot operations
We should regularly clear the model from any view,
that might have occurred while developing data model.
Remove all pprint from the build_pivot() method.
  def build_pivot(self) -> None:
    try:
      self.all_dates = {
        row[1]: [item[2]
        for item in self.all_values
        if item[1] == row[1]]
          for row in self.all_values
      }

      self.occurrences = {
        date: {cat: row.count(cat) for cat in set(row)}
        for date, row in self.all_dates.items()
      }

      self.ensure_occurrences = {
        date: {
          cat: pairs.get(cat, 0)
          for cat in self.categories
        }
        for date, pairs in self.occurrences.items()}

    except Exception as e:
      print("An error occurred " \
        + f"while processing data: {e}")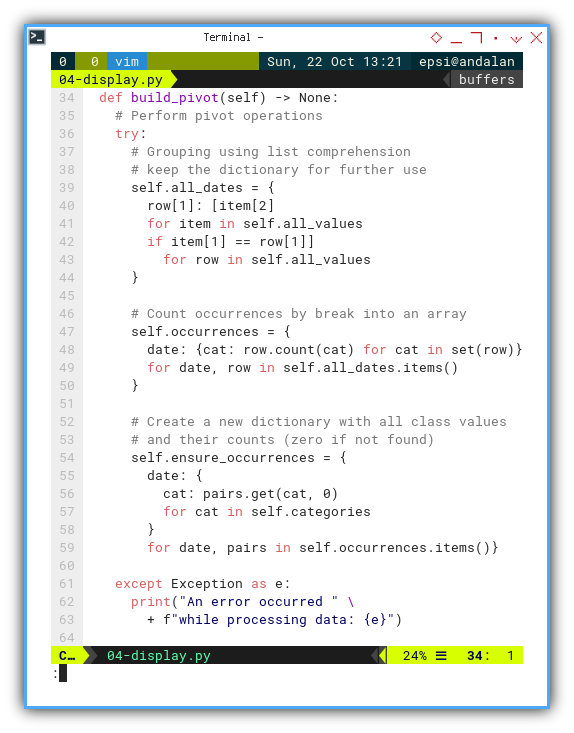
This is the final version of this build_pivot() method.
The Main Display Method
There is a lot happening on the display. We have four new methods here.
  def display(self) -> None:
    if self.header is None:
      print("No data to display.")
    else:
      self.display_basic()
      self.display_process()

      self.display_pivot_header()
      self.display_pivot_rows()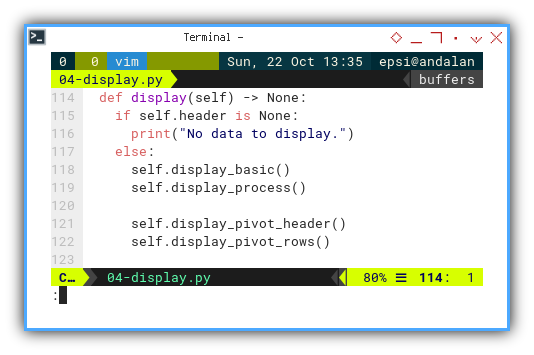
Display Basic: Plain Table
Sometimes we need to look back, at the original data.
  def display_basic(self) -> None:
    # Display the header
    # ['Number', 'Date', 'Fruit']
    print(self.header)

    # Display the data
    # ['1', '19/02/2017', 'Orange']
    for row in self.all_values:
      print(row)

    print()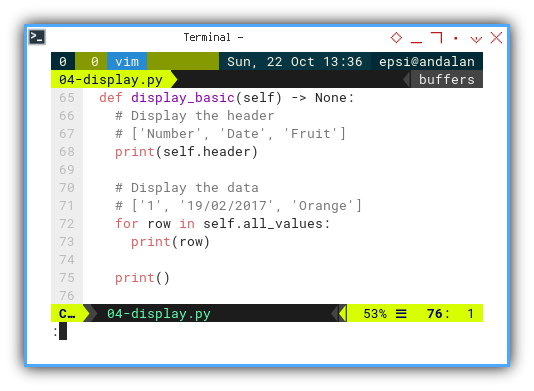
Display Process: Data Transformation
For debugging purposes, I document the example result of each data transformation
  def display_process(self) -> None:
      # '19/02/2017': ['Orange', 'Grape', 'Strawberry', 'Orange',
      #   'Apple', 'Banana', 'Strawberry', 'Banana', 'Strawberry']
      print(self.all_dates)
      print()

      # '19/02/2017': {'Mango': 2, 'Banana': 3, 'Apple': 1,
      #   'Strawberry': 4, 'Grape': 2, 'Orange': 3}
      print(self.occurrences)
      print()

      # {'19/02/2017': {'Apple': 1, 'Banana': 3, 'Dragon Fruit': 0,
      #  'Durian': 0, 'Grape': 2, 'Mango': 2,
      #  'Orange': 3, 'Strawberry': 4}
      print(self.ensure_occurrences)
      print()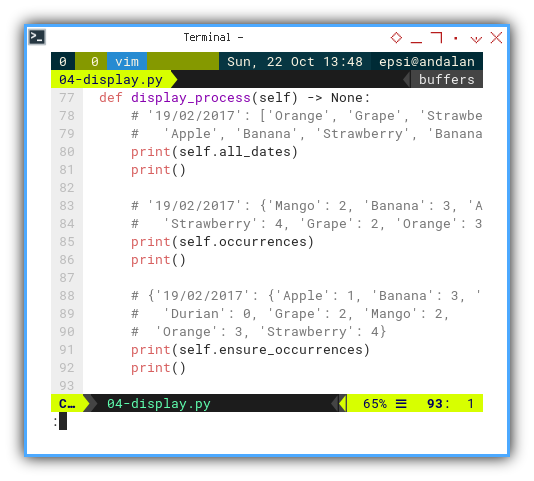
Display Pivot Header: Categories
  def display_pivot_header(self) -> None:
    line_title = "Date/Fruit"
    for cat in self.categories:
       line_title += f"\t{cat}"

    print(line_title)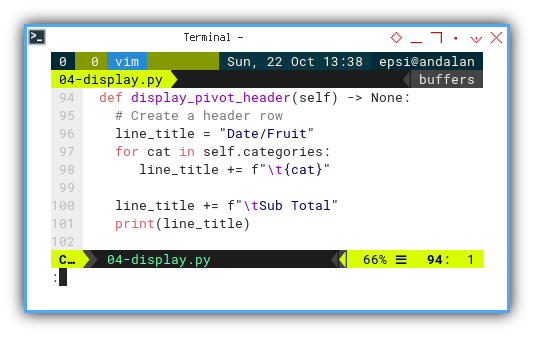
Display Pivot Rows: Count
  def display_pivot_rows(self) -> None:
    for date, pairs in \
        self.ensure_occurrences.items():
      line_row = f"{date}"

      for cat, count in pairs.items():
        line_row += f"\t{count}"

      print(line_row)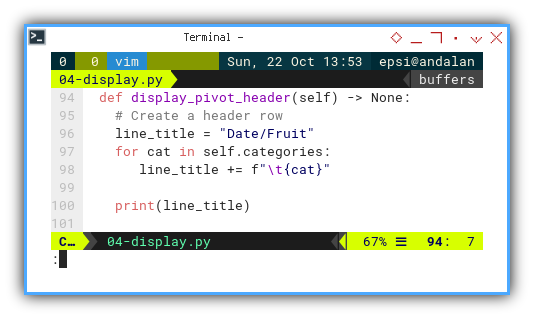
The Pivot Result Example
The pivot result example, can be shown as below. The spacing might looks different, because I use tabs instead of spaces.
Date/Fruit	Apple	Banana	Dragon Fruit	Durian	Grape	Mango Orange	Strawberry
19/02/2017	1	3	0	0	2	2	3	4
20/02/2017	0	4	0	0	0	2	2	2
21/02/2017	2	1	0	0	4	4	2	3
22/02/2017	4	1	0	0	1	1	4	5
23/02/2017	1	4	0	0	3	5	6	3
24/02/2017	2	3	0	0	4	2	5	5
25/02/2017	1	2	0	0	4	1	1	1
26/02/2017	4	2	0	0	2	2	3	4
27/02/2017	3	3	0	0	4	1	4	1
28/02/2017	3	2	0	0	3	4	3	2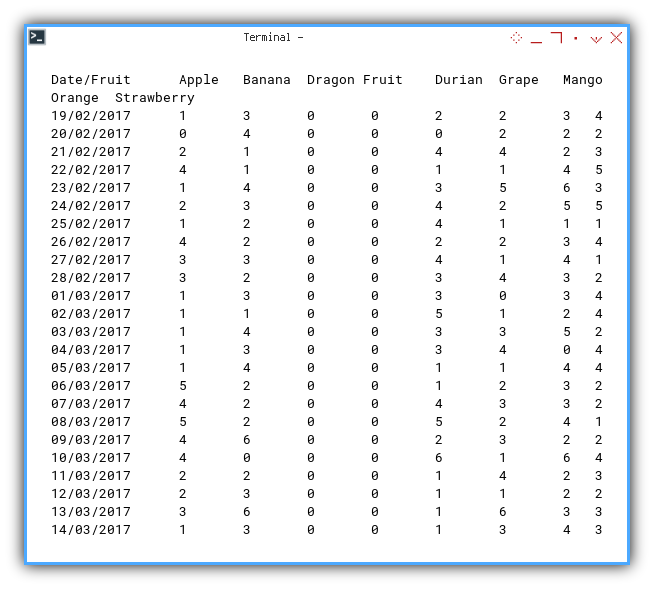
It’s not a perfect display, but at least we have a preview.
Displaying Total
What good is pivot without total summary? We are going to create three kinds of total.
- Total Row
- Total Column
- Grand Total
Each process stands in its own method,
that all called in display() method.
For the sake of clarity, I do not follow standard UML diagram.
Class Skeleton
There is only one additional method
class PivotSample:
  ...

  def display_pivot_header(self) -> None:
    ...

  def display_pivot_rows(self) -> None:
    ...

  def display_pivot_total(self) -> None:
    ...

  def display(self) -> None:
    ...
While the display_pivot_total() method show the total at the bottom.
The row total at the rightmost column is done in display_pivot_rows().
Total Header
We need to add additional Sub Total title in the header.
  def display_pivot_header(self) -> None:
    # Create a header row
    line_title = "Date/Fruit"
    for cat in self.categories:
       line_title += f"\t{cat}"

    line_title += f"\tSub Total"
    print(line_title)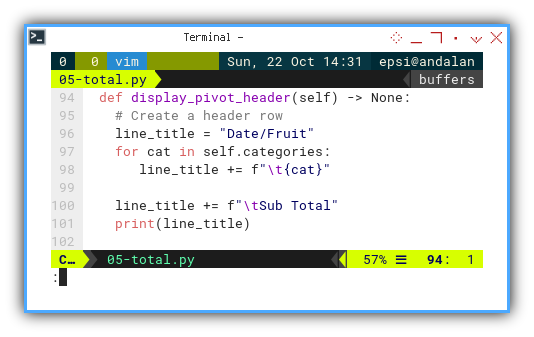
Total Row
For every row, we also add an additional column, that sums all the values in that row.
  def display_pivot_rows(self) -> None:
    # Create rows for each category
    for date, pairs in \
        self.ensure_occurrences.items():
      line_row = f"{date}"

      for cat, count in pairs.items():
        line_row += f"\t{count}"

      # Calculate the total for each column
      total = sum(pairs.values())
      line_row += f"\t{total}"

      print(line_row)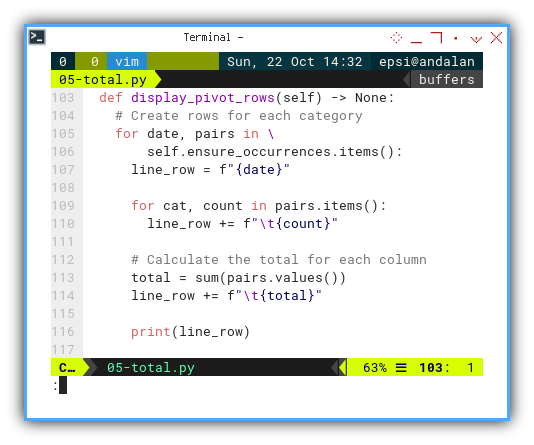
Total Column and Grand Total
To create a total row: sum of the column.
This is a new method, The task is adding an additional row, at the bottom of the table. Starting from the left header, with the sum of column values, and ending with the grand total.
  def display_pivot_total(self) -> None:
    line_total = "Grand Total"
    total = {}

    for cat in self.categories:
      total[cat] = 0

      for date, pairs in \
          self.ensure_occurrences.items():
        total[cat] += pairs[cat]

      line_total += f"\t{total[cat]}"

    line_total += f"\t{sum(total.values())}"
    print(line_total)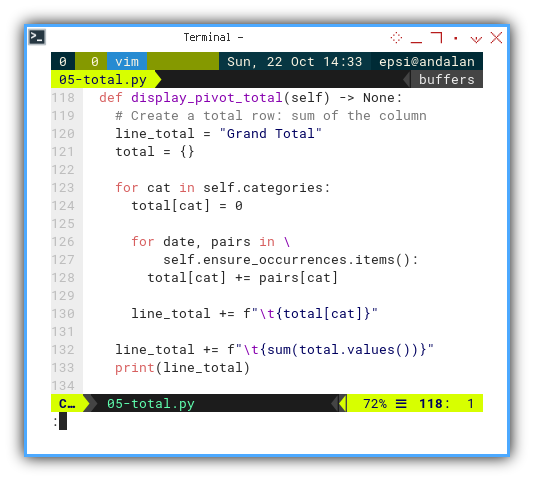
Pivot Display
We do not need to display all the stuff. All we need is just the pivot. So I commented out any unnecessary output.
  def display(self) -> None:
    if self.header is None:
      print("No data to display.")
    else:
      # self.display_basic()
      # self.display_process()

      self.display_pivot_header()
      self.display_pivot_rows()
      self.display_pivot_total()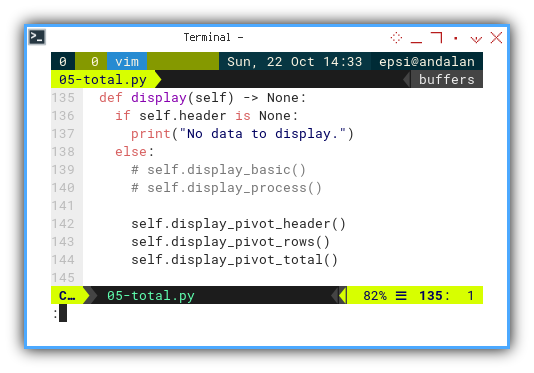
The Pivot Result Example
The pivot result example, can be shown as below. You can adjust the spacing manually for better looks.
❯ python 05-total.py
Date/Fruit	Apple	Banana	Dragon Fruit	Durian	Grape	Mango	Orange	Strawberry	Sub Total
19/02/2017	1	3	0	0	2	2	3	4 	15
20/02/2017	0	4	0	0	0	2	2	2 	10
21/02/2017	2	1	0	0	4	4	2	3 	16
22/02/2017	4	1	0	0	1	1	4	5 	16
...
...
...
02/04/2017	1	1	0	0	5	4	5	1 	17
03/04/2017	4	0	0	0	3	3	3	5 	18
04/04/2017	0	2	0	0	2	1	3	3 	11
05/04/2017	3	1	0	0	1	2	2	4 	13
Grand Total	114	125	0	0	127	115	148	126	755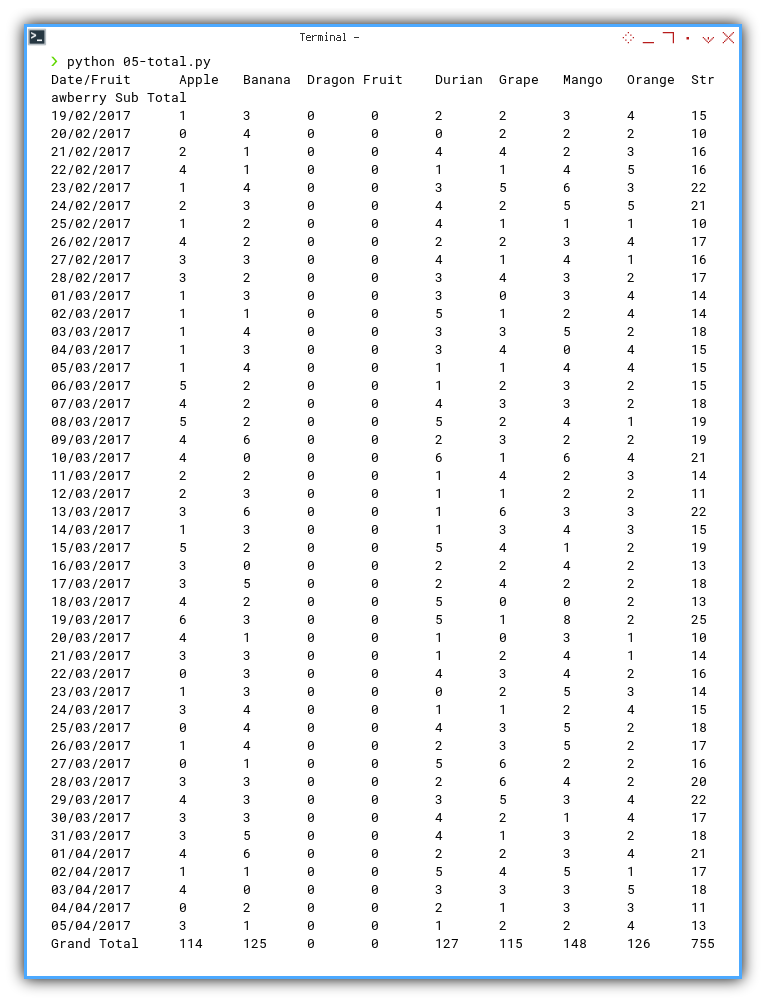
We got ourselves, a very basic pivot table.
Compare
Let’s compare it with our previous worksheet.
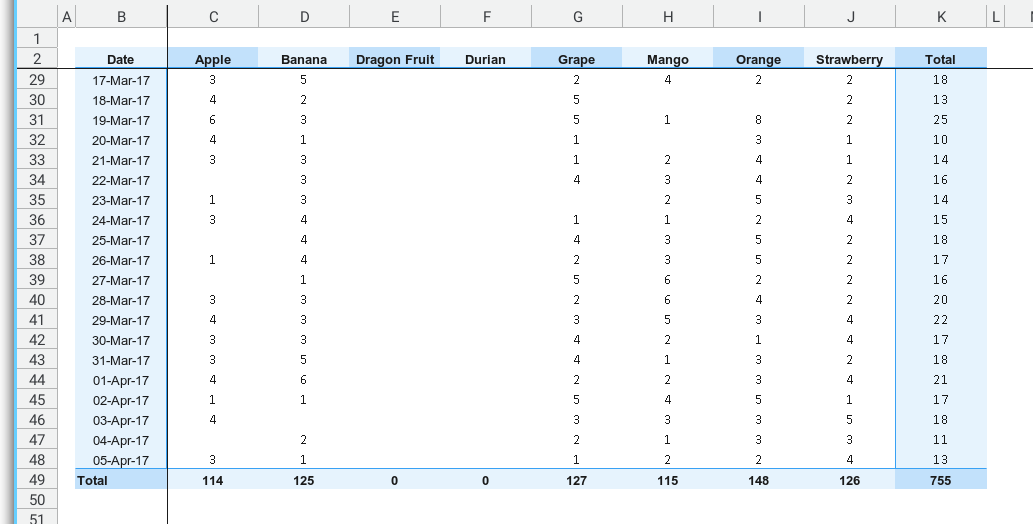
Since the count number are the same. I think we are doing just fine.
What’s Up Next 🤔?
Feeling dizzy yet? We are going to simplify this pivot-building process using a dataframe.
Consider continuing to read [ Pivot - Model - Dataframe ].