Preface
Goal: Adding total column and total row.
We are going to complete the pivot dataframe, with total column, total row, grand total, along with the display representation.
Our journey to complete the pivot dataframe: with total column, total row, and grand total, along with their display representation, is nearing its conclusion.
Total: Main Script
Our primary objective now is to: add the total column and total row functionalities.
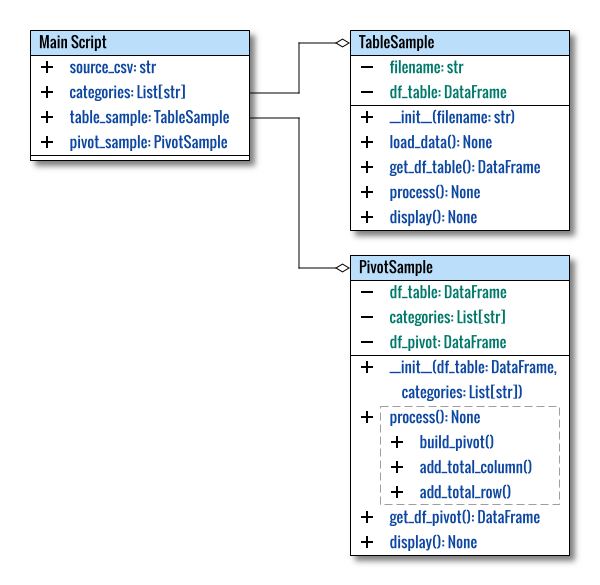
Class Diagram
The class diagram exhibits only slight modifications, compared to the previous one.
Directory Structure
Let’s maintain an organized structure by placing classes in their respective lib directory.
.
├── 13-pivot.py
└── lib
    ├── PivotSample.py
    └── TableSample.py
Since the PivotSample is simple enough to be matured.
Let’s remove the numbering to enhance its readability.
We will consistently use both TableSample and PivotSample classes,
throughout the tutorial.
Program Entry Point
The script’s content remains identical to the previous example.
Total: Table Sample Class
We continue to use the same libraries as in the previous section.
Total: Pivot Sample Class
In this section, we introduce a few additional methods that enhance the total feature of the Pivot Sample class, accompanied by a few supplementary lines.
Class Skeleton
The structure of the class remains consistent, serving the dual purpose of ensuring predefined categories and summing the total.
class PivotSample:
  def __init__(self,
      df_table: DataFrame,
      categories: List[str]) -> None:
    ...

  def build_pivot(self) -> None:
    ...

  def add_total_column(self):
    ...

  def add_total_row(self):
    ...

  def access_headers_and_column(self):
    ...

  def get_df_pivot(self) -> DataFrame:
    return self.df_pivot

  def process(self) -> None:
    ...

  def display(self) -> None:
    ...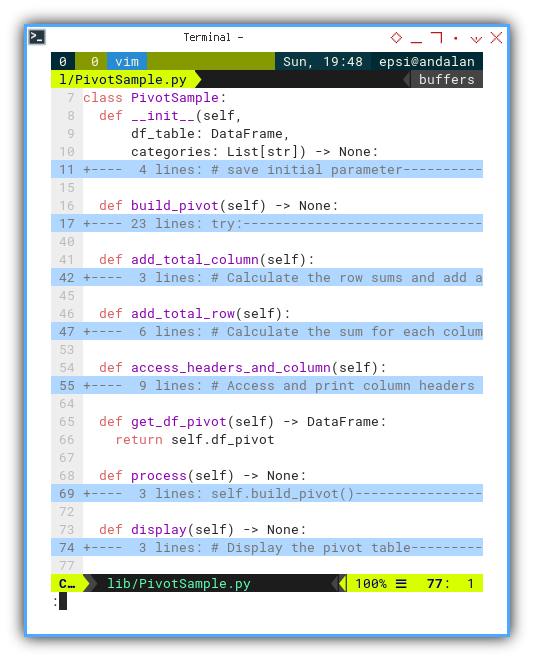
An additional method, access_headers_and_column(),
has been incorporated to exemplify the access to cell values in the dataframe matrix.
Total Column
Implementing a total column with a dataframe is concise, yet comprehending the underlying process is crucial.
  def add_total_column(self):
    # Calculate the row sums and add a total column
    row_sums = self.df_pivot.sum(axis=1)
    self.df_pivot[('Total Date', 'Total')] = row_sums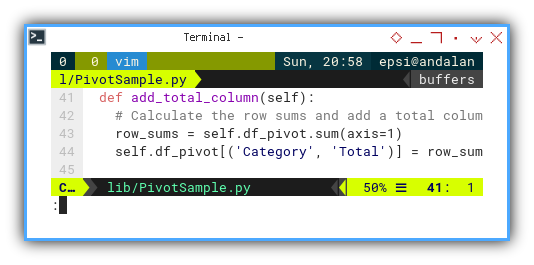
This line effectively appends a Total column to the DataFrame, capturing the sum of values in each row.
row_sums = self.df_pivot.sum(axis=1)
print(row_sums)
With the result as below:
Date
2017-02-19    15
2017-02-20    10
2017-02-21    16
2017-02-22    16
2017-02-23    22
2017-02-24    21
...
This line calculates the sum of values, in each row of the DataFrame self.df_pivot. The axis=1 argument specifies that the summation, should be performed along rows.
The resulting row_sums is a pandas Series object, embodying the summation of values for each row, facilitated by the axis=1 argument.
self.df_pivot[('Total Date', 'Total')] = row_sumsThis line introduces a new column to the DataFrame self.df_pivot,
with the name (‘Total Date’, ‘Total’).
The name is a MultiIndex, where
- The first level is ‘Total Date’, and
- The second level is ‘Total’.
The values for this column align with the row_sums Series
obtained in the previous step.
An examination of the MultiIndex is demonstrated below:
Column Headers: MultiIndex([(    'Number',        'Apple'),
            (    'Number',       'Banana'),
            (    'Number', 'Dragon Fruit'),
            (    'Number',       'Durian'),
            (    'Number',        'Grape'),
            (    'Number',        'Mango'),
            (    'Number',       'Orange'),
            (    'Number',   'Strawberry'),
            ('Total Date',        'Total')],
           names=[None, 'Fruit'])
Accompanied by the result:
Pivot Table:
           Number         ...            Total Date
Fruit       Apple Banana  ... Strawberry      Total
2017-02-19      1      3  ...          4         15
2017-02-20      0      4  ...          2         10
2017-02-21      2      1  ...          3         16
2017-02-22      4      1  ...          5         16
2017-02-23      1      4  ...          3         22
...           ...    ...  ...        ...        ...
2017-04-02      1      1  ...          1         17
2017-04-03      4      0  ...          5         18
2017-04-04      0      2  ...          3         11
2017-04-05      3      1  ...          4         13
Total         114    125  ...        126        755

[47 rows x 9 columns]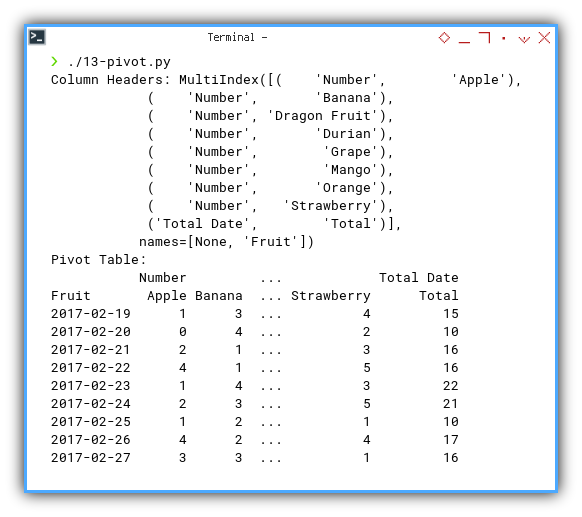
Total Row
Although the process for total rows is lengthier, it offers increased clarity, reducing the need for extensive explanation.
  def add_total_row(self):
    # Calculate the sum for each column
    # and add a total row
    total_row = self.df_pivot.sum().to_frame().T
    total_row.index = ['Total']
    self.df_pivot = pd.concat(
      [self.df_pivot, total_row])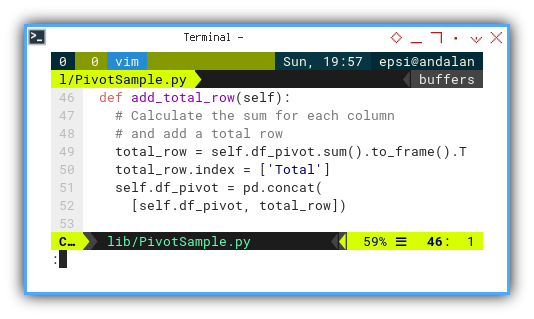
    track     = self.df_pivot.sum()
    total_row = track.to_frame().T

    print(track)
Resulting in the following:
          Fruit
Number    Apple           114
          Banana          125
          Dragon Fruit      0
          Durian            0
          Grape           127
          Mango           115
          Orange          148
          Strawberry      126
Category  Total           755
dtype: int64
Following this, the dataframe is converted accordingly:
    track     = self.df_pivot.sum().to_frame()
    total_row = track.T

    print(track)
With the result as below:
                           0
           Fruit
Number     Apple         114
           Banana        125
           Dragon Fruit    0
           Durian          0
           Grape         127
           Mango         115
           Orange        148
           Strawberry    126
Total Date Total         755
Subsequent to transposing:
    total_row = self.df_pivot.sum().to_frame().T
    print(total_row)
With the result as below:
      Number         ...            Total Date
Fruit  Apple Banana  ... Strawberry      Total
Total    114    125  ...        126        755

[1 rows x 9 columns]
The two dataframes can be merged seamlessly using the concat function.
Process
The process method appends both columns and rows after the pivot is built.
  def process(self) -> None:
    self.build_pivot()
    self.add_total_column()
    self.add_total_row()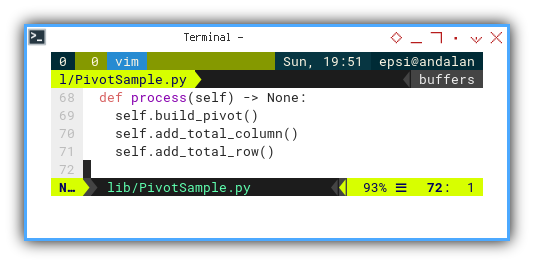
Display
The beauty of dataframes lies in, their adept handling of display features, resulting in remarkably concise code.
  def display(self) -> None:
    # Display the pivot table
    print("Pivot Table:")
    print(self.df_pivot)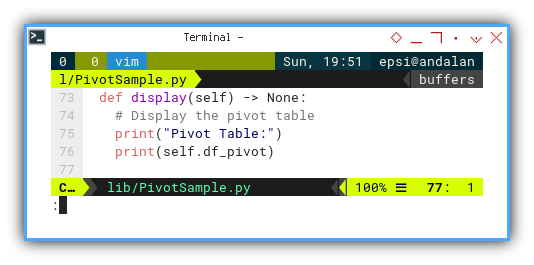
Our code will be amazingly slim.
Result
The culmination of these processes leads to a satisfying result.
❯ ./13-pivot.py
Header: Index(['Number', 'Date', 'Fruit'], dtype='object')
Data:
     Number        Date       Fruit
0         1  19/02/2017      Orange
1         2  19/02/2017       Grape
2         3  19/02/2017  Strawberry
3         4  19/02/2017      Orange
4         5  19/02/2017       Apple
..      ...         ...         ...
750     751  05/04/2017  Strawberry
751     752  05/04/2017  Strawberry
752     753  05/04/2017       Mango
753     754  05/04/2017  Strawberry
754     755  05/04/2017      Banana

[755 rows x 3 columns]
Pivot Table:
Number ... Total Date
Fruit Apple Banana ... Strawberry Total
2017-02-19 1 3 ... 4 15
2017-02-20 0 4 ... 2 10
2017-02-21 2 1 ... 3 16
2017-02-22 4 1 ... 5 16
2017-02-23 1 4 ... 3 22
... ... ... ... ... ...
2017-04-02 1 1 ... 1 17
2017-04-03 4 0 ... 5 18
2017-04-04 0 2 ... 3 11
2017-04-05 3 1 ... 4 13
Total 114 125 ... 126 755
[47 rows x 9 columns]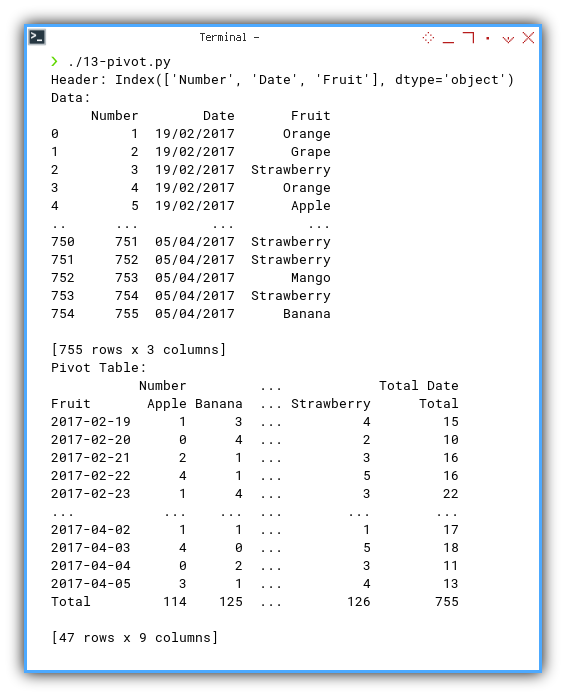
Activity Diagram
To provide a visual summary, an activity diagram chronologically depicts the entire process.
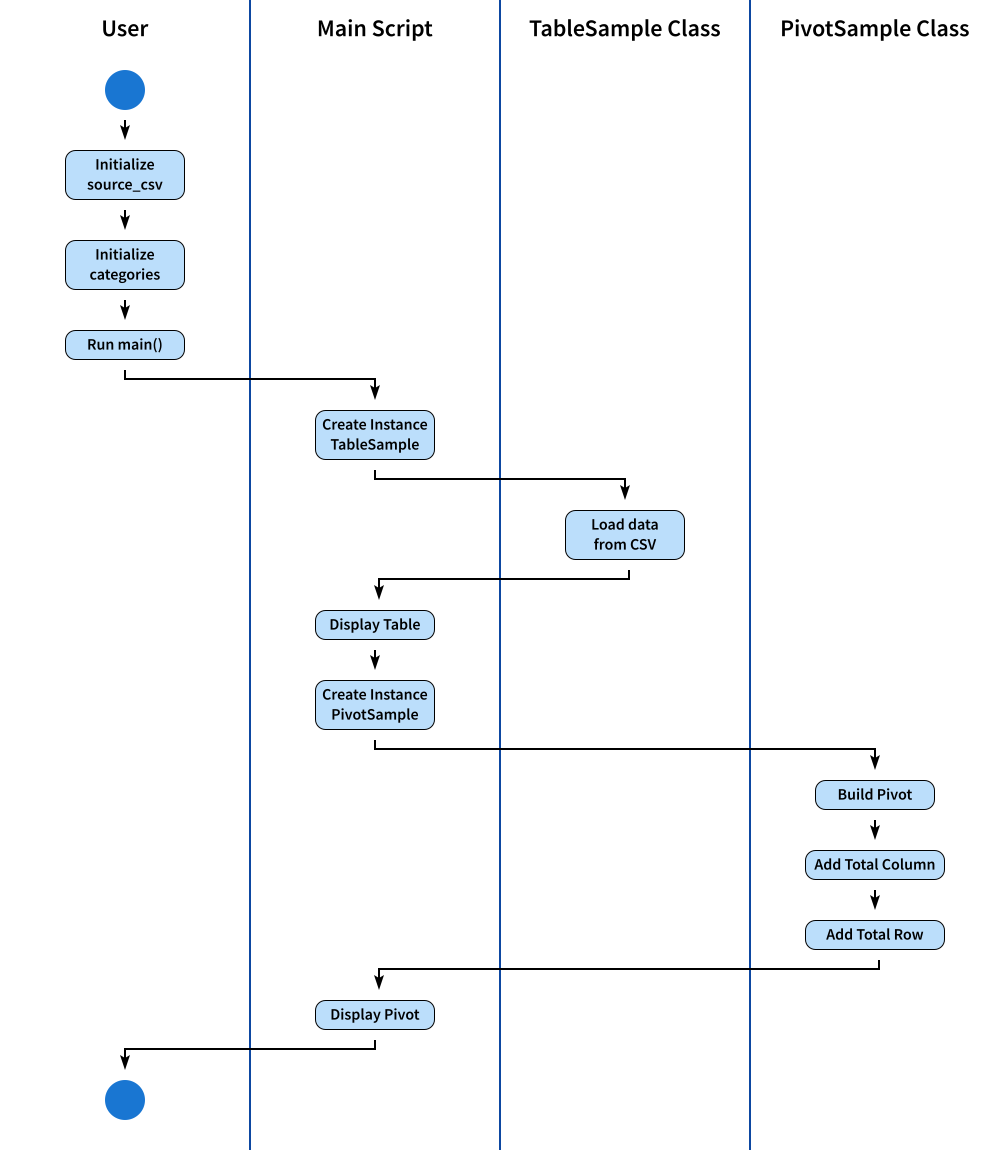
For those interested in customization, the SVG source is available for modification.
Compare
It’s crucial to conduct a thorough comparison with our previous worksheet to ensure accuracy and consistency.
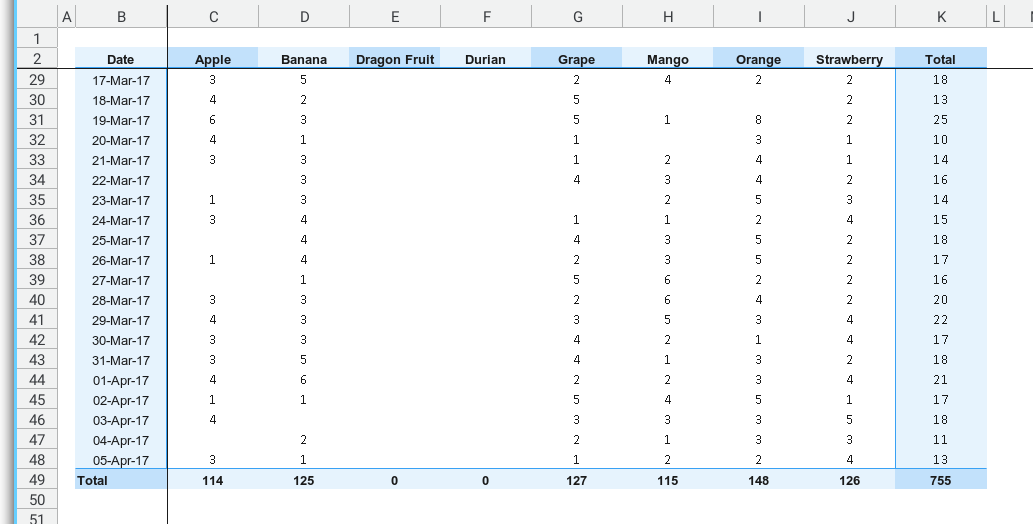
Upon inspection, the count numbers remain consistent for the second time. It appears that our process is performing as expected, reflecting the reliability of our data modeling.
I think we are doing just fine.
What’s the Next Chapter 🤔?
With data modeling completed, the next phase awaits us in the subsequent section We are now poised to transition to the creation of the view within the worksheet.
Consider continuing your exploration in [ Pivot - openPyXL - Table Writer ].
This phase promises to delve into the practicalities of translating our data into a tangible and structured format using openPyXL.