Preface
Goal: Writing custom dataframe to custom sheet, with the case of pivot
Transitioning from a simple dataframe to a custom sheet introduces us to a practical scenario of handling pivot data. While this task may not be inherently complex, it encapsulates various permutations that one may encounter in day-to-day data processing.
The challenges in real-life scenarios often involve diverse custom dataframes, leading to the need for tailored sheets. The objective here is not merely creating a pivot table, but empowering individuals to tackle their specific challenges. Rather than being spectators, the aim is to engage readers in problem-solving within their unique contexts.
Let’s embark on this journey.
Pivot Sheet: Main Script
We are embarking on the creation of two sheets:
- Table Sheet
- Pivot Sheet
With the initial sheet, Table Sheet, already in place, our focus now shifts to the pivot sheet. Our goal is to write each cell, along with its respective decorations.
Preview
The envisioned worksheet is straightforward, avoiding excessive embellishments but ensuring practicality for repetitive tasks.
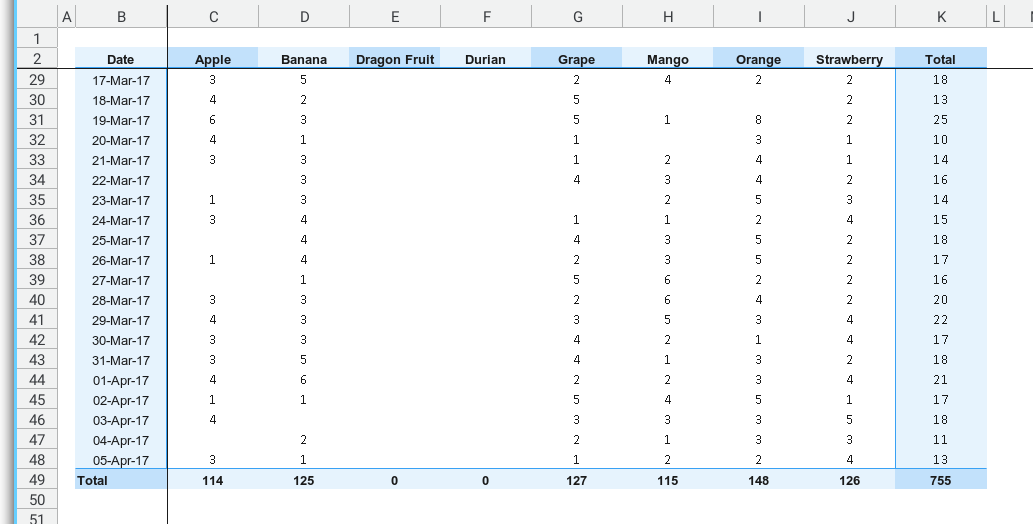
The simpler the better. But not too plain.
Aim for simplicity, yet not devoid of character.
Class Diagram
For a holistic understanding of the entire structure, the class diagram is illustrated below:
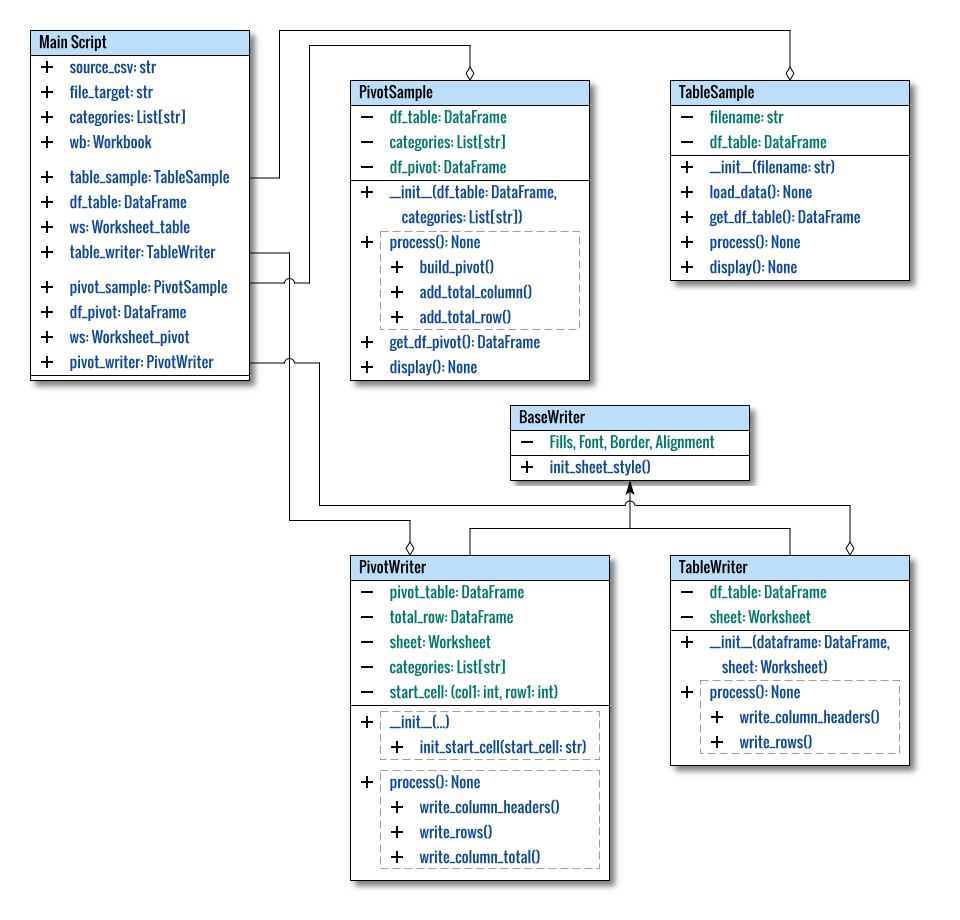
Presenting the main script in a class format provides a clear visualization of the overall structure.
Local Libraries
Just
PivotWriter.
Among the four local libraries,
we already have mature classes for the first three.
Our primary concern lies in the PivotWriter. class.
# openPyXL
from openpyxl import Workbook

# Local Library
from lib.TableSample import TableSample
from lib.PivotSample import PivotSample
from lib.TableWriter import TableWriter
from lib.PivotWriter import PivotWriter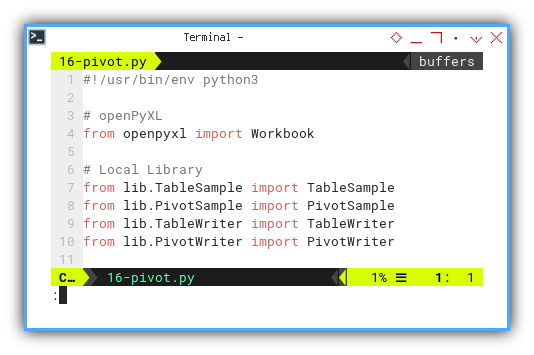
Directory Structure
Reflecting the directory structure adds clarity:
.
├── 16-pivot.py
└── lib
    ├── TableSample.py
    ├── PivotSample.py
    ├── BaseWriter.py
    ├── TableWriter.py
    └── PivotWriter.py
Main Method
The initial segment involves custom variables, and categories for class initialization.
def main() -> None:
  file_source = 'sample-data.csv'
  file_target = 'Example.xlsx'

  categories = [
    "Apple", "Banana", "Dragon Fruit",
    "Durian", "Grape", "Mango",
    "Orange", "Strawberry"]
The subsequent step entails preparing the dataframe,
where df_table serves as the foundation for creating df_pivot.

def main() -> None:
  ...

  table_sample = TableSample(file_source)
  table_sample.process()
  table_sample.display()
  df_table = table_sample.get_df_table()

  pivot_sample = PivotSample(df_table, categories)
  pivot_sample.process()
  pivot_sample.display()
  df_pivot = pivot_sample.get_df_pivot()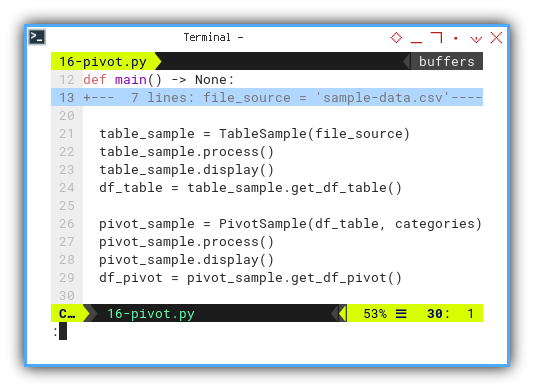
In the final part, df_table contributes
to crafting the Table sheet,
while df_pivot plays a role
in forming the Pivot sheet.
  wb = Workbook()
  ws = wb.active
  ws.title = 'Table'

  table_writer = TableWriter(df_table, ws)
  table_writer.process()

  # Create a new sheet
  ws = wb.create_sheet(title='Pivot')
  wb.active = ws

  pivot_writer = PivotWriter(
    df_pivot, ws, categories, 'B2')
  pivot_writer.process()

  # Save the file
  wb.save(file_target)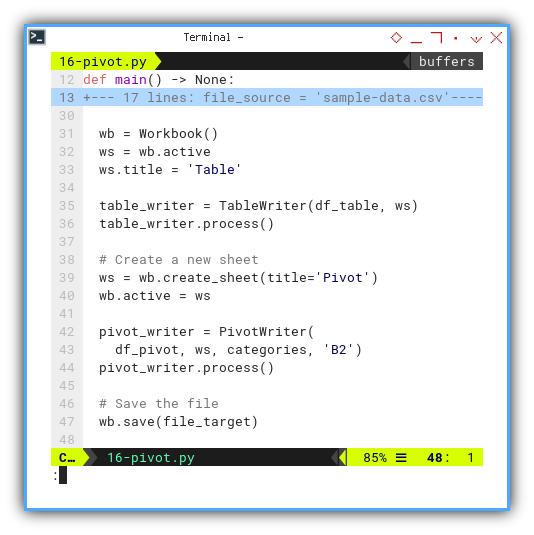
Concluding the process,
we save the resulting workbook as Example.xlsx.
The sequence of code neatly outlines
the flow of this particular case.
Pivot Sheet: Table Writer Class
Library
Introducing a few additional libraries,
ranging from optional List types for passing categories,
to some openPyXL utilities.
from typing import List
from pandas import DataFrame
from datetime import datetime

# openPyXL
from openpyxl.worksheet.worksheet import Worksheet
from openpyxl.styles import (Color,
  PatternFill, Font, Border, Side, Alignment)

from openpyxl.utils import (
  get_column_letter, column_index_from_string)
from openpyxl.utils.cell import coordinate_from_string

# Local Library
from lib.BaseWriter import BaseWriter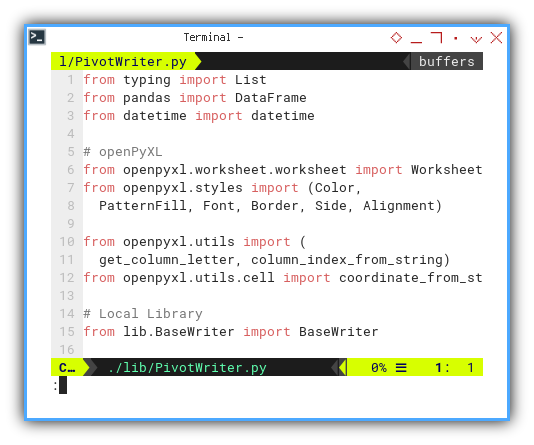
Class Skeleton
A long class
Presenting another descendant class, the class structure may seem extensive at first glance, but the underlying process is remarkably clear.
class PivotWriter(BaseWriter):
  def __init__(self,
      pivot_table: DataFrame,
      sheet: Worksheet,
      categories: List[str],
      start_cell: str) -> None:
    ...

  def init_start_cell(self, start_cell: str) -> None:
    ...

  def write_column_headers(self) -> None:
    ...

  def write_row_header(self,
      row_index: int, date: int) -> None:
    ...

  def write_row_content(self,
      row_index: int, row) -> None:
    ...

  def write_row_total(self,
      row_index: int, row) -> None:
    ...

  def write_column_total_header(self):
    ...

  def write_column_total_content(self):
    ...

  def write_column_total_grand(self):
    ...

  def write_rows(self) -> None:
    ...

  def write_column_total(self) -> None:
    ...

  def process(self) -> None:
    ...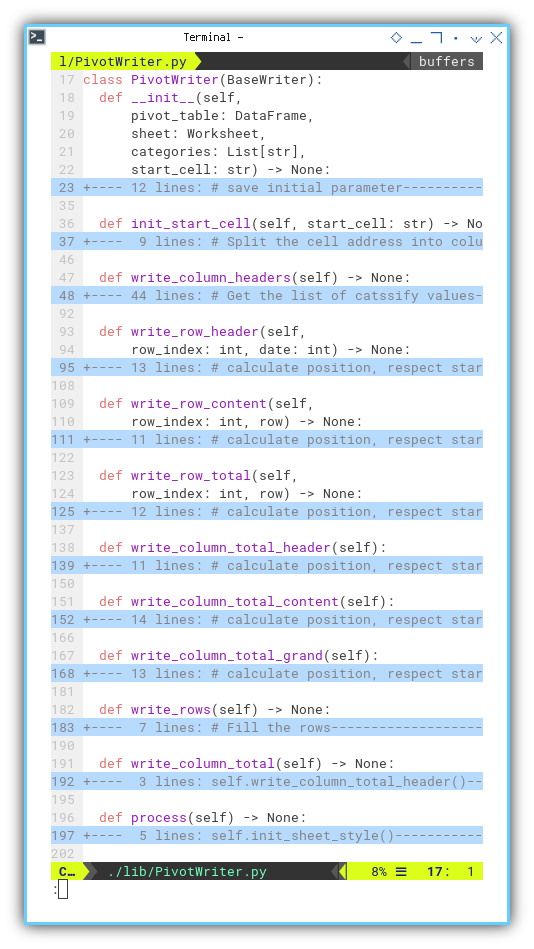
This time, we take into account the significance of init_start_cell, offering flexibility to position the table wherever needed.
Initialization
The initialization phase, begins by capturing the initial parameters, and subsequently processing the initial start cell.
class PivotWriter(BaseWriter):
  def __init__(self,
      pivot_table: DataFrame,
      sheet: Worksheet,
      categories: List[str],
      start_cell: str) -> None:

    # save initial parameter
    self.pivot_table = pivot_table
    self.sheet = sheet
    self.categories = categories
    self.init_start_cell(start_cell)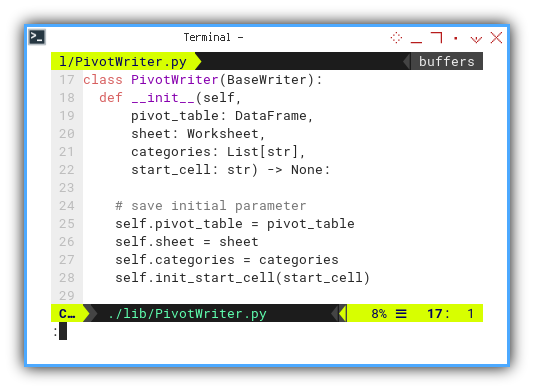
Within this initialization section,
we address the challenge posed by the total dataframe.
Given that iterrows iterates over all rows,
the last row, representing totals, requires special consideration.
To resolve this, we split the total row, and place it at the bottom of the dataframe. The split is executed using the code below:
    # Get the 'Total' row as a separate variable
    self.total_row = self.pivot_table.loc['Total']

    # Exclude the 'Total' row from the DataFrame
    self.pivot_table = self.pivot_table.drop('Total')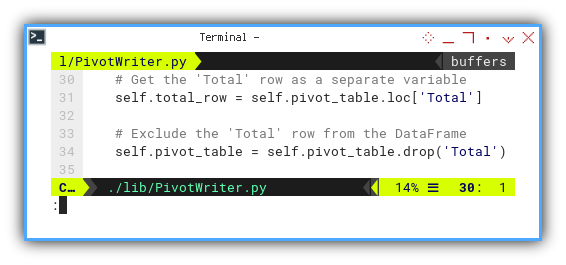
Process
This serves as the core method of the class.
  def process(self) -> None:
    self.init_sheet_style()

    self.write_column_headers()
    self.write_rows()
    self.write_column_total()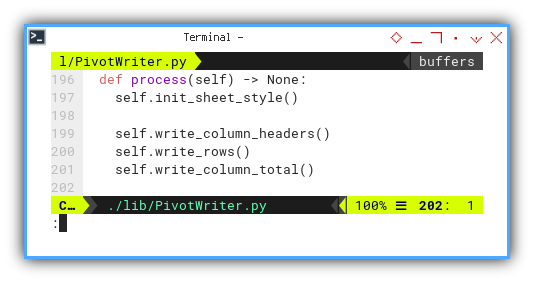
The flow is straightforward:
- First Row: Comprising a single header row
- Data Rows: Encompassing multiple data rows
- Last Row: Constituting a single total row
Writing Rows
The rows themselves consist of numerous columns:
  def write_rows(self) -> None:
    # Fill the rows
    row_index = 0
    for date, row in self.pivot_table.iterrows():
      row_index += 1
      self.write_row_header (row_index, date)
      self.write_row_content(row_index, row)
      self.write_row_total  (row_index, row)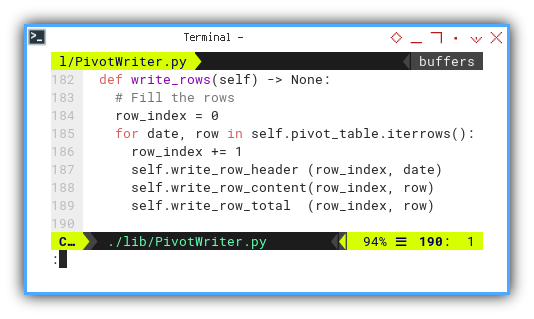
The process flow remains lucid:
-
First Column: Featuring a single date index column
-
Data Columns: Incorporating multiple data columns for each category
-
Last Column: Comprising a single total column
Total Column
The total rows also include three types of columns.
  def write_column_total(self) -> None:
    self.write_column_total_header()
    self.write_column_total_content()
    self.write_column_total_grand()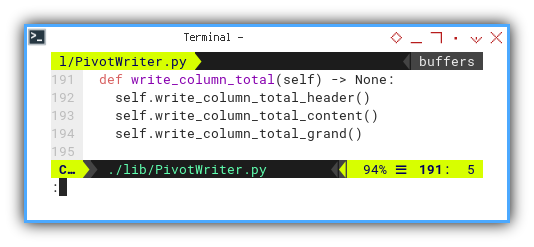
-
First Column: A cell housing the
Totallabel -
Data Columns: Consisting of multiple cells for the total of each category
-
Last Column: Hosting a solitary grand total cell
Starting Cell Location
Designing the table to be flexible is prudent,
for instance it can initiate from A1 cell,
or alternatively, begin from B2 cell if necessary.
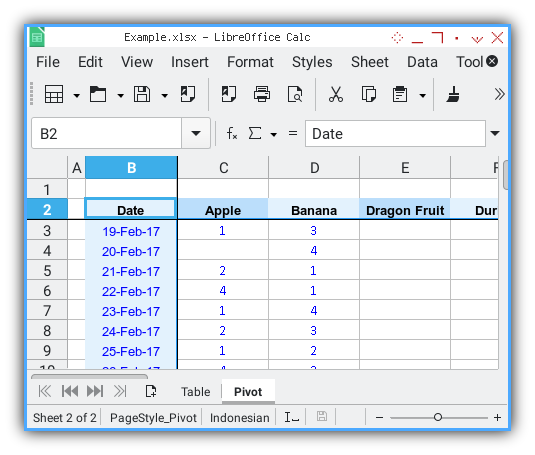
The code is a simple definition of the first row and first column as follows:
  def init_start_cell(self, start_cell: str) -> None:
    # Split the cell address into column and row parts
    column_letter, row_number = \
      coordinate_from_string(start_cell)

    # Convert the column letter to column index
    self.col1 = column_index_from_string(column_letter)

    # Convert the row number to row index
    self.row1 = int(row_number)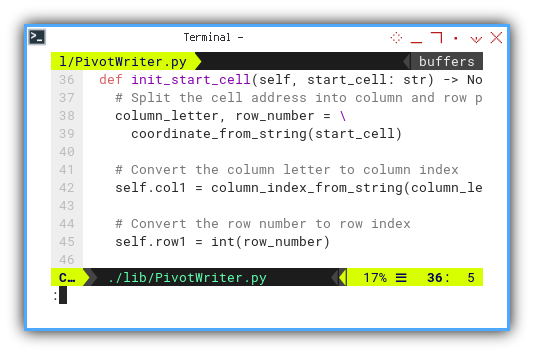
Pivot Sheet: Header
Preview Result
This is the envisioned outcome.
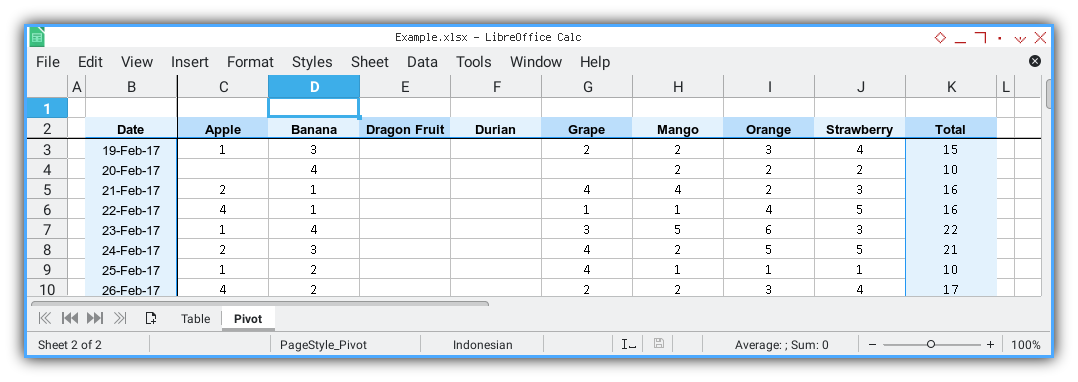
Within the header method, various aspects are addressed:
- Header Name List
- Enumerating List
- Decorating Cell Header
- Column Width
- Freeze Point
Allright now, I’ll provide an individual breakdown for each element.
Header Name List
The sequence of the header columns is as follows:
-
First Column: Labeled as
Dateand serves as the index -
Data Columns: Comprising multiple cells, each named after a category
-
Last Column: Labeled as
Total
  def write_column_headers(self) -> None:
    # Get the list of header values
    lookup_cats = ['Date'] + self.categories + ['Total']

    # column width shortcut
    wscd = self.sheet.column_dimensions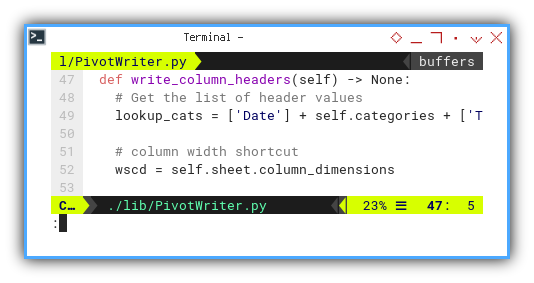
Enumerate List
Here where we apply the start cell for header cell positioning.
  def write_column_headers(self) -> None:
    ...

    # Fill the cells horizontally
    for col, cat in enumerate(lookup_cats, start=0):

      # calculate position, respect start cell
      col_pos = self.col1 + col
      row_pos = self.row1

      cell = self.sheet.cell(row_pos, col_pos)
      cell.value = cat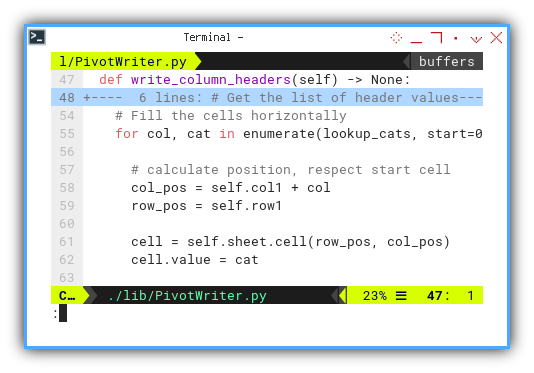
Decorate Cell Header
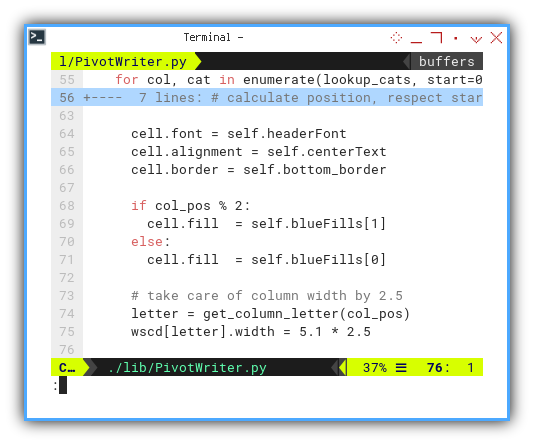
Each cell requires suitable decoration. I’ve opted to distinguish each cell visually, by altering the fill color of odd and even cell.
    # Fill the cells horizontally
    for col, cat in enumerate(lookup_cats, start=0):
      ...

      cell.font = self.headerFont
      cell.alignment = self.centerText
      cell.border = self.bottom_border

      if col_pos % 2:
        cell.fill  = self.blueFills[1]
      else:
        cell.fill  = self.blueFills[0]

      # take care of column width by 2.5
      letter = get_column_letter(col_pos)
      wscd[letter].width = 5.1 * 2.5
Additionally, I’ve set a specific column width, for each header cell, utilizing a factor of 2.5.
Column Gap Width
I would like to have small gap, on the left and on the right of the cell. So I can have a padding when copy paste the cell as image to whatsapp.
I’ve incorporated a slight gap, on both the left and right sides of the cell. This subtle padding proves beneficial, when copying and pasting the cell, as an image to platforms like WhatsApp.
    # left and right padding
    if self.col1 > 1:
      letter = get_column_letter(self.col1 - 1)
      wscd[letter].width = 5.1 * 0.5

    letter = get_column_letter(
      self.col1 + len(lookup_cats))
    wscd[letter].width = 5.1 * 0.5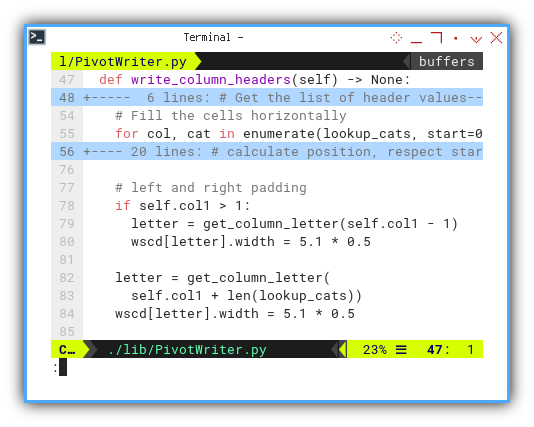
Freeze Point
To enhance user experience, a freeze panes feature has been introduced, with an offset of (1 col, 1 row) relative to the table.
    # Set the freeze point to Offset (1,1)
    column_index  = self.col1 + 1
    row_index     = self.row1 + 1
    column_letter = get_column_letter(column_index)
    self.sheet.freeze_panes = \
      f'{column_letter}{row_index}'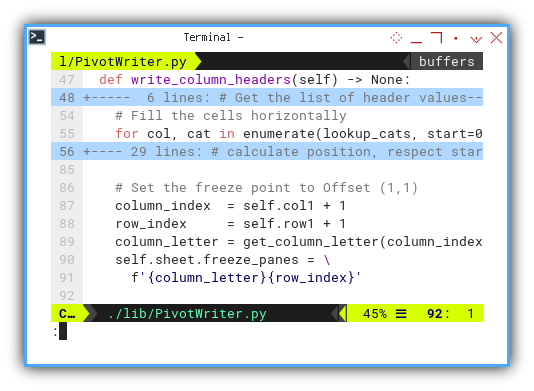
The resulting image above provides, a clear representation of the executed design.
Pivot Sheet: Rows
Preview Result
This represents the desired outcome.
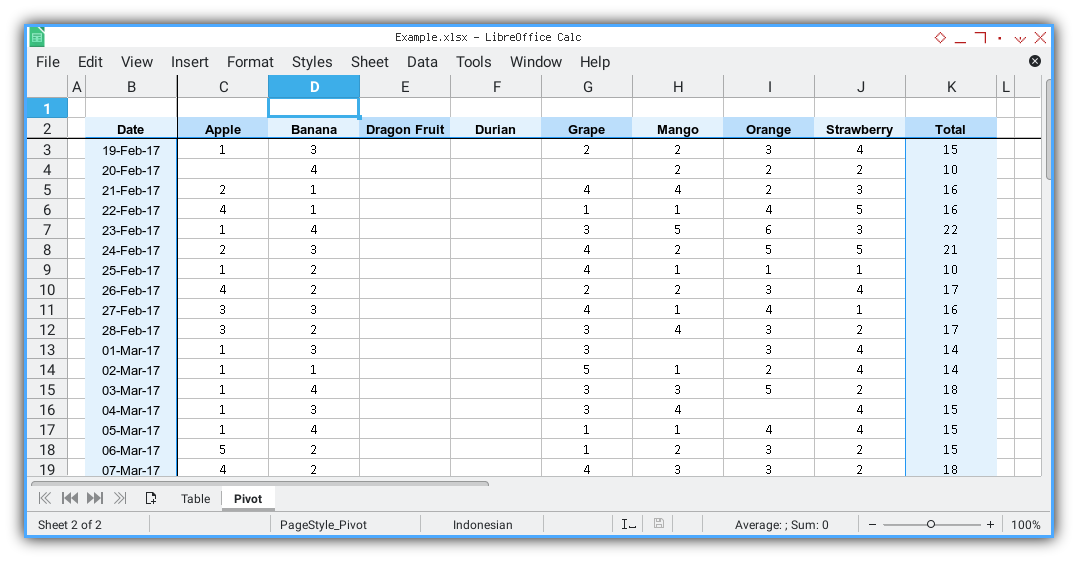
Writing Rows: Skeleton
The framework for the rows writer follows this structure:
-
First Column: Single date index column
-
Data Columns: Multiple data cells for each category
-
Last Column: Single total column
  def write_rows(self) -> None:
    # Fill the rows
    row_index = 0
    for date, row in self.pivot_table.iterrows():
      row_index += 1
      self.write_row_header (row_index, date)
      self.write_row_content(row_index, row)
      self.write_row_total  (row_index, row)
It’s essential to note that
we have the date serving as the header index value,
with row category information stored in the row.
Writing Rows: Left Header
Initiating the process involves determining the cell position.
  def write_row_header(self,
      row_index: int, date: int) -> None:

    # calculate position, respect start cell
    col_pos = self.col1
    row_pos = self.row1 + row_index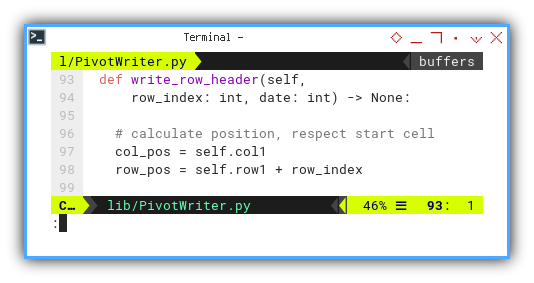
Following this, assigning the cell value, and ensuring the appropriate number format is applied.
    cell = self.sheet.cell(row_pos, col_pos)
    cell.value = date
    cell.number_format = 'DD-MMM-YY;@'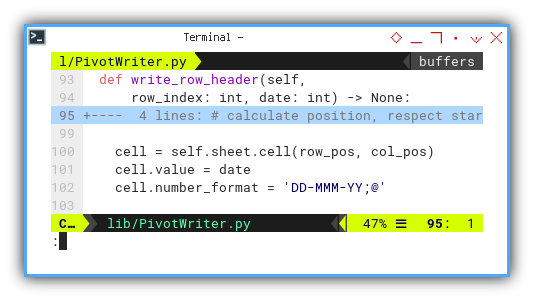
Finally, incorporating the desired decorations.
    cell.font      = self.normalFont
    cell.alignment = self.centerText
    cell.border    = self.right_border
    cell.fill      = self.blueFills[0]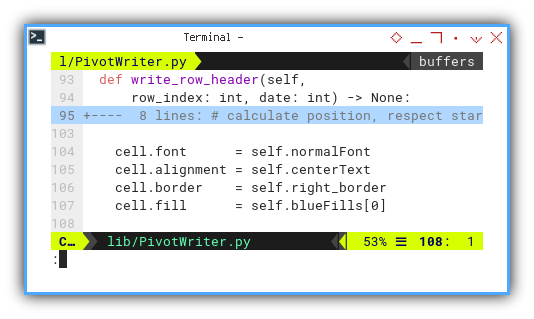
Writing Rows: Count Content
Access dataframe using: row[(‘Number’, cat)]
This phase also commences with cell positioning, specifying the row and column locations in the forthcoming loop.
  def write_row_content(self,
      row_index: int, row) -> None:

    # calculate position, respect start cell
    row_pos = self.row1 + row_index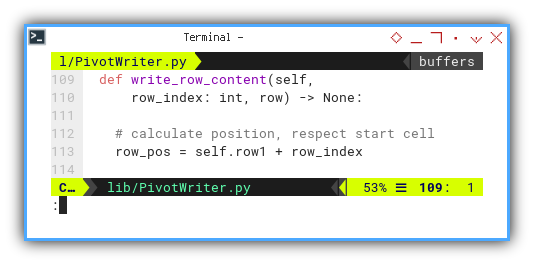
The count for each cell,
can be accessed using row[('Number', cat)],
employing the walrus := operator.
In cases where the count value is zero,
we may choose not to store a value in the cell.
    for col, cat in enumerate(self.categories, start=1):
      if count := int(row[('Number', cat)]):
        col_pos = self.col1 + col
        cell = self.sheet.cell(row_pos, col_pos)

        cell.value = count
        cell.alignment = self.centerText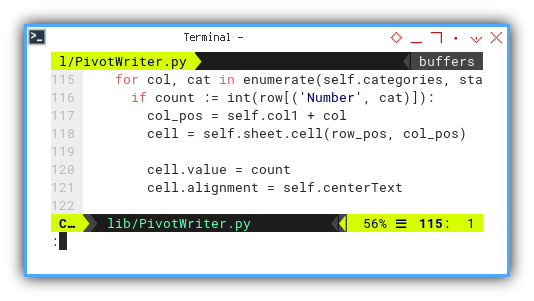
Writing Rows: Right Total
Access dataframe using:
row[('Total Date')]
As customary, we initiate the process, by establishing the cell position.
  def write_row_total(self,
      row_index: int, row) -> None:

    # calculate position, respect start cell
    len_col = len(self.categories)
    row_pos = self.row1 + row_index
    col_pos = self.col1 + len_col + 1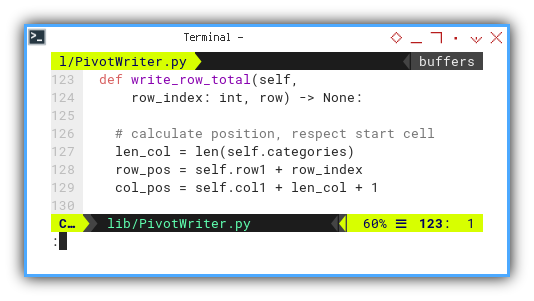
The right total value for a given date,
is accessible through row['Total Date'].
    cell = self.sheet.cell(row_pos, col_pos)
    cell.value     = int(row['Total Date'])

    cell.alignment = self.centerText
    cell.border    = self.left_border
    cell.fill      = self.blueFills[0]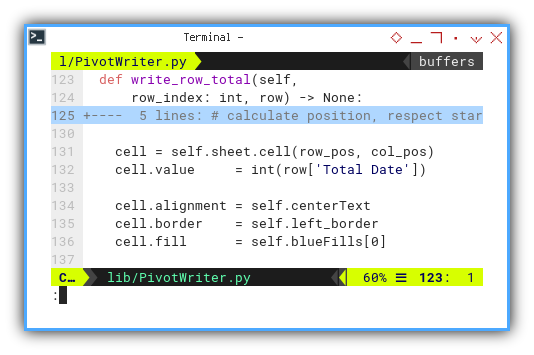
With this, we conclude the execution of several rows.
Pivot Sheet: Total
Preview Result
This exemplifies the intended outcome.
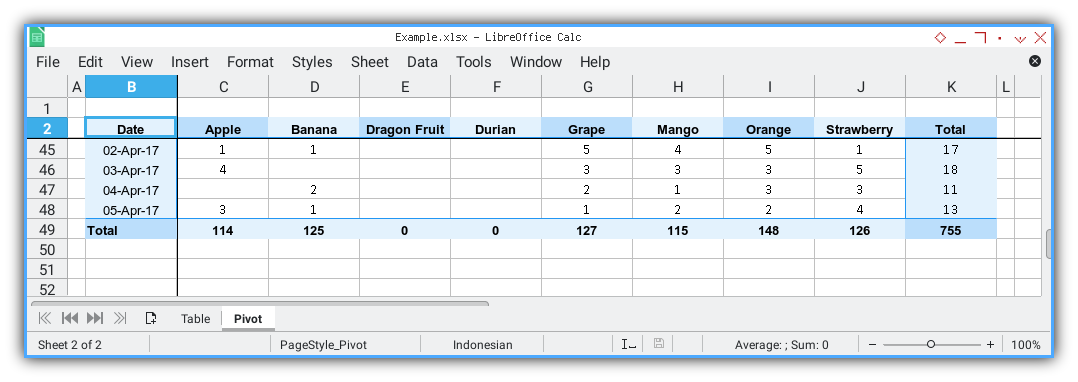
Total Column: Skeleton
The structure of the total column writer follows this sequence:
-
First Column: A cell containing the
Totallabel -
Data Columns: Multiple cells representing totals for each category
-
Last Column: A single grand total cell
  def write_column_total(self) -> None:
    self.write_column_total_header()
    self.write_column_total_content()
    self.write_column_total_grand()
Writing Total Column Total: Header
The
Totallabel.
Remaining consistent with the cell’s starting address, we calculate the index for its location.
  def write_column_total_header(self):
    # calculate position, respect start cell
    len_row = len(self.pivot_table)
    col_pos = self.col1
    row_pos = self.row1 + len_row + 1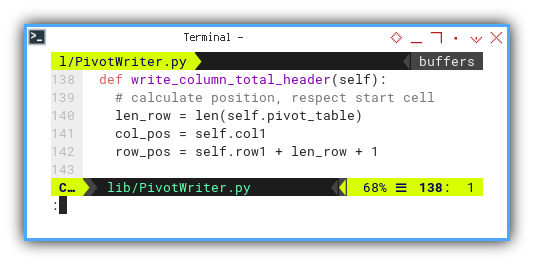
There is nothing special here.
just the Total label.
    cell = self.sheet.cell(row_pos, col_pos)
    cell.value = 'Total'

    cell.font   = self.headerFont
    cell.border = self.top_border
    cell.fill   = self.blueFills[1]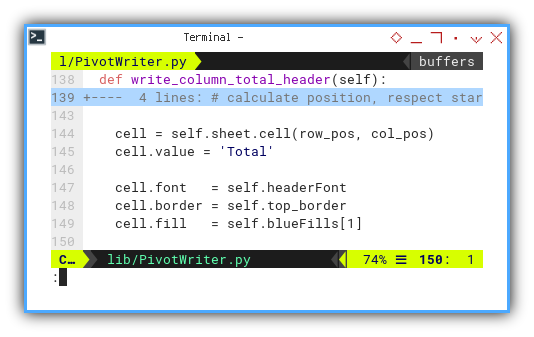
Writing Total Column Totals: Content
Access dataframe using: row[(‘Number’, cat)]
Respecting the cell’s starting address, we calculate the row’s position index.
  def write_column_total_content(self):
    # calculate position, respect start cell
    len_row = len(self.pivot_table)
    row_pos = self.row1 + len_row + 1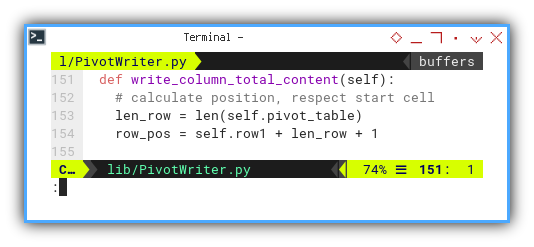
Iterating until the end of the row with enumeration,
the value for each bottom total
can be obtained through row[('Number', cat)].
Even if the count value is zero, the total can still be displayed as zero, in the respective bottom cell.
    len_row = len(self.pivot_table)
    for col, cat in enumerate(self.categories, start=1):
      col_pos = self.col1 + col
      cell = self.sheet.cell(row_pos, col_pos)
      cell.value = int(self.total_row[('Number', cat)])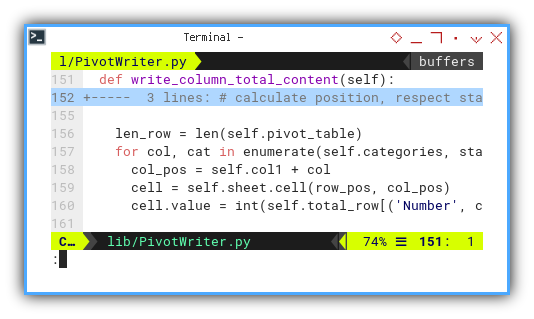
Additionally, we need to implement decorations, to distinguish the appearance of the bottom total.
      cell.font = self.headerFont
      cell.alignment = self.centerText
      cell.border = self.top_border
      cell.fill  = self.blueFills[0]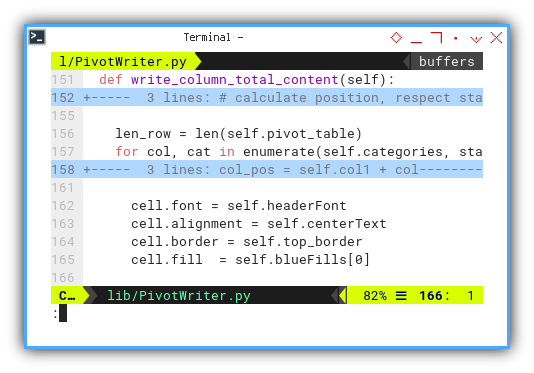
Writing Total Column Total: Grand Total
Access dataframe using:
row[('Total Date')]
The cell’s address index is straightforwardly derived, from the starting point plus its length.
  def write_column_total_grand(self):
    # calculate position, respect start cell
    len_col = len(self.categories)
    len_row = len(self.pivot_table)
    col_pos = self.col1 + len_col + 1
    row_pos = self.row1 + len_row + 1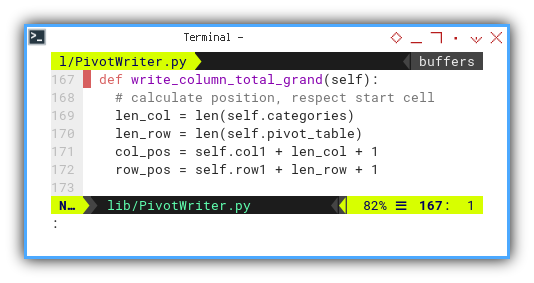
Once again, we apply decorations.
    cell = self.sheet.cell(row_pos, col_pos)
    cell.value = int(self.total_row['Total Date'])

    cell.font      = self.headerFont
    cell.alignment = self.centerText
    cell.border    = self.top_border
    cell.fill      = self.blueFills[1]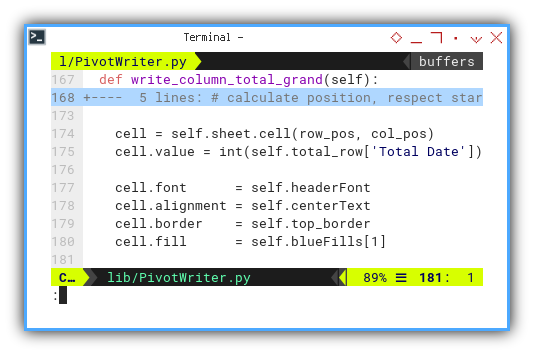
Activity Diagram
Providing a summary, the entire process is presented in this chronological order.
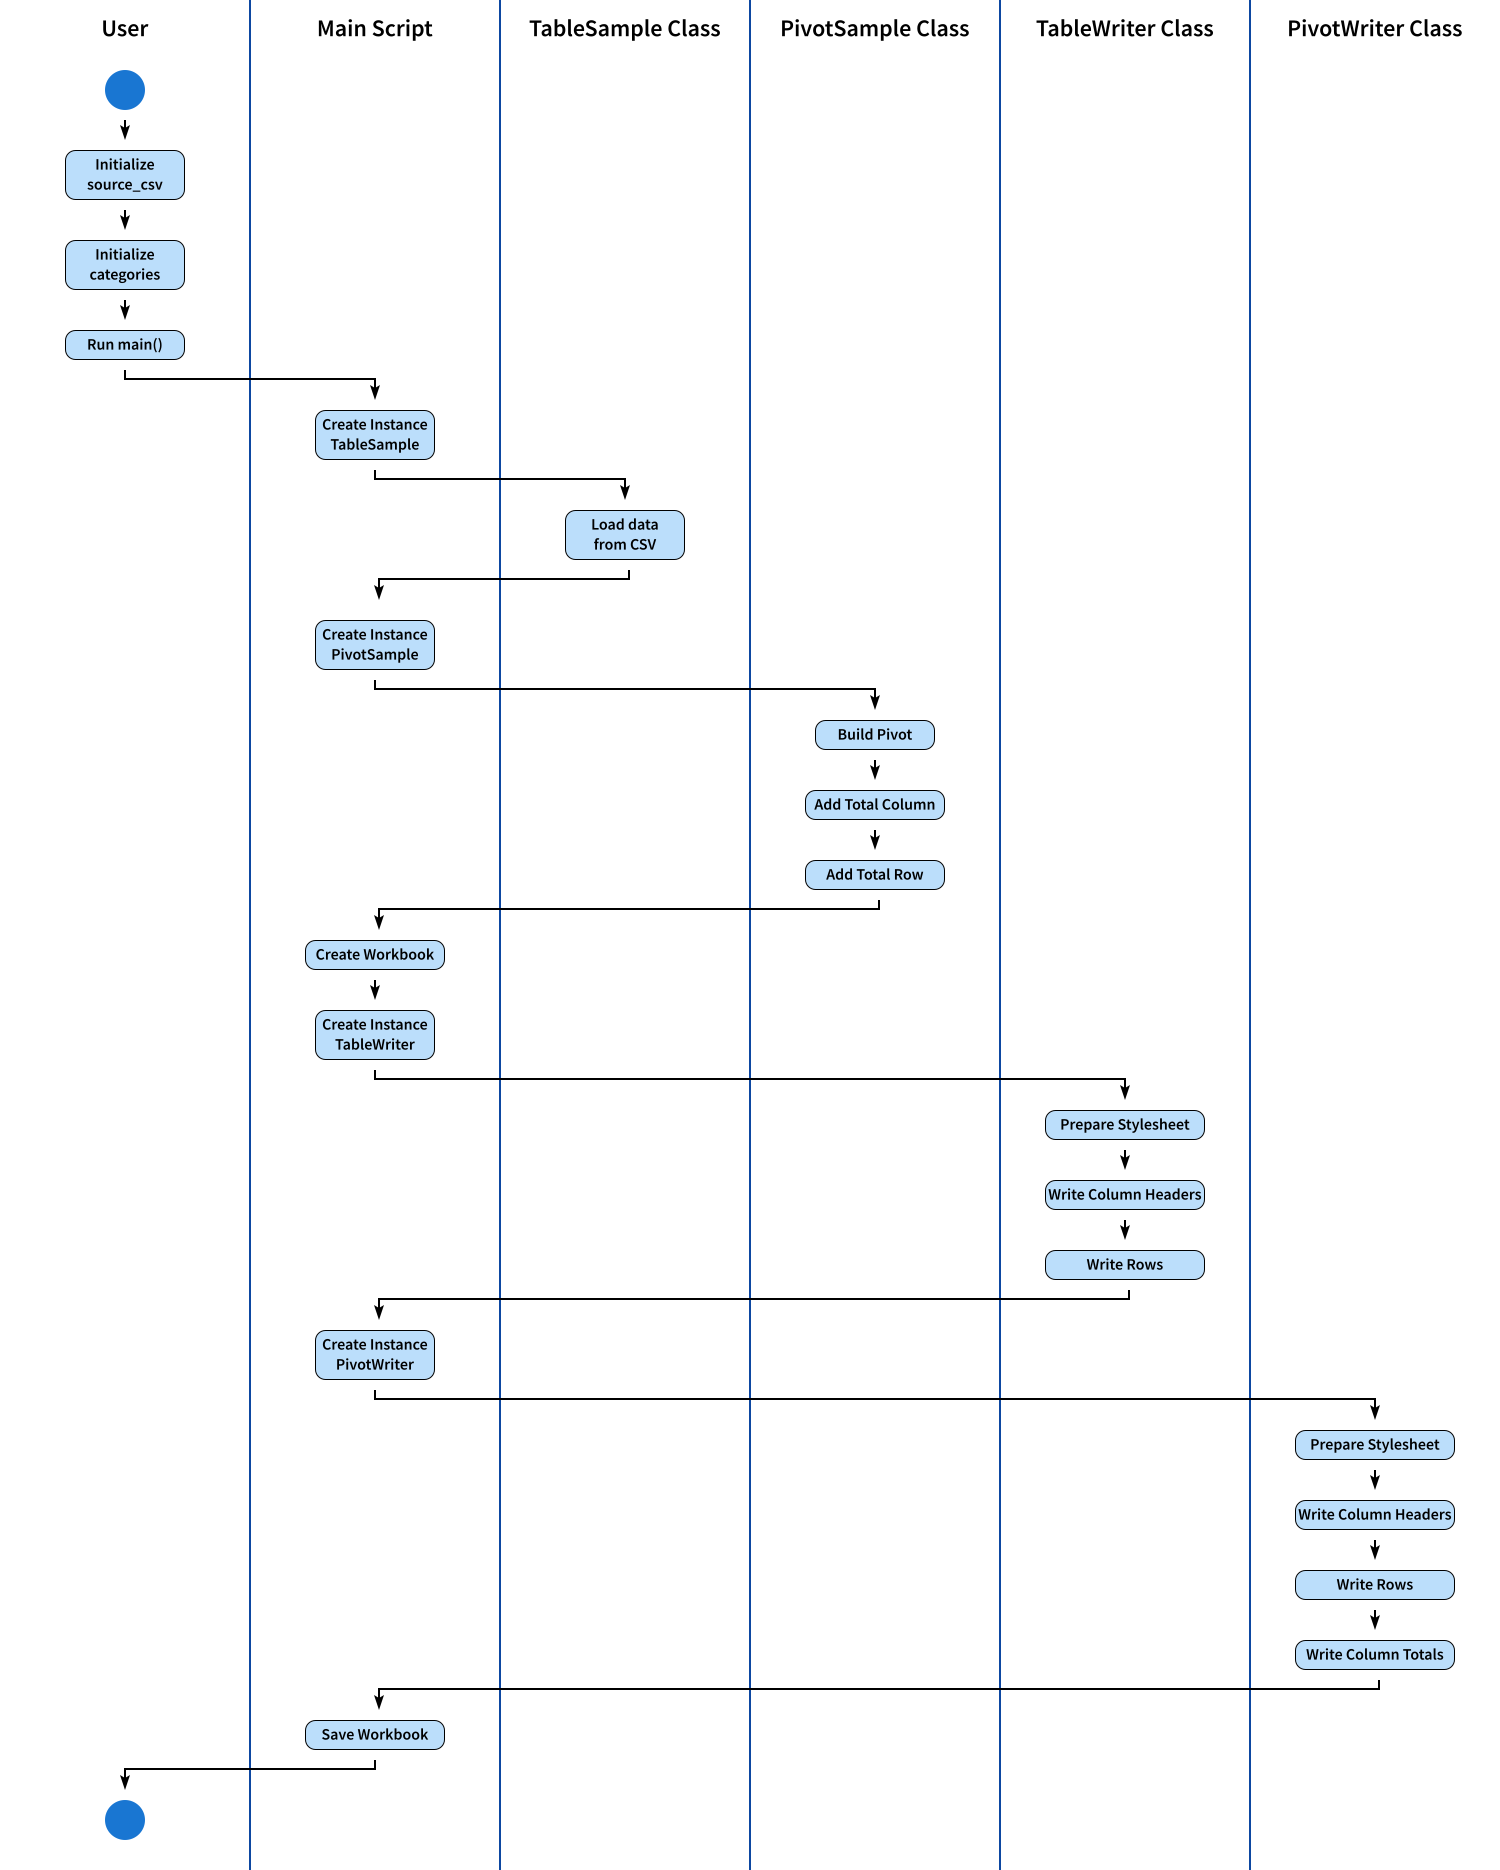
The SVG source can be accessed here, allowing you to customize it according to your preferences.
Total Result
The ultimate result is showcased in the following screenshot:

What’s on the Horizon 🤔?
Real-life scenarios often present diverse challenges. While as a digital native you might anticipate receiving a tidy CSV as your data source, clients or stakeholders may prefer providing information in the form of a spreadsheet.
In such instances, having a dataframe capable of reading from a table sheet and subsequently generating the pivot sheet within the same workbook becomes essential.
Feel free to delve deeper into this process by continuing your exploration [ Pivot - openPyXL - Table Reader ].