Preface
Goal: Simple conditional cell coloring using openpyxl.
Why Coloring?
Have you ever have to analyze data by the value of the cell? Well, if the data is a few, there is no problem with that. But when it comes to hundred of data, your eyes is going to be so weary.
The solution is using color to spot anomaly, instead of using the value itself.
What Color?
The Puppy Case.
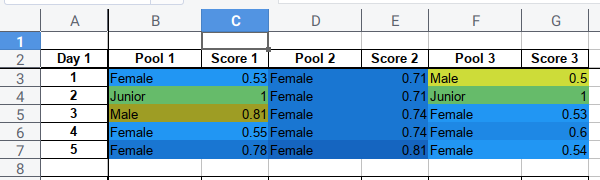
Imagine a case, you have three cameras that could identify dogs, by gender and age, and also with the confidence score.
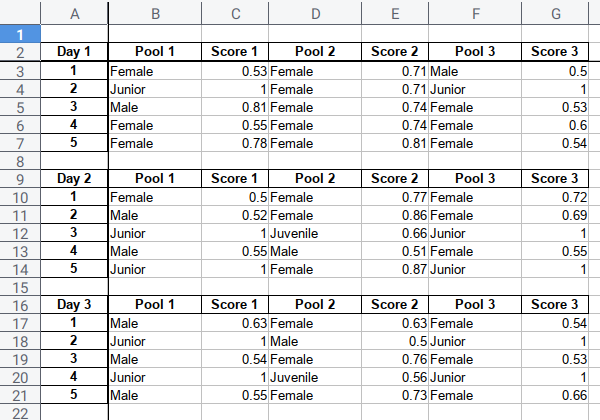
You can color, not just by the result. But also the gradient based on the confidence score.
The figure above is a simplification of real data.
Example Data
You can download here
Why Automation?
Time savings.
With so many worksheets, as a weekly routine, manual coloring really is an exhausting task. This takes so many working hours, and it is also so tedious that it become error prone.
This is where python comes saving you precious office hours. This means, you can do many thing else, beside just coloring. You still have to do further pivot analysis, or things like statistics.
Shortly, we should invest on thinking, rather than doing tedious repetitive task.
Simple Coloring
Consider getting started from simple thing. Have a look at this source code.
Accessing Cell Value
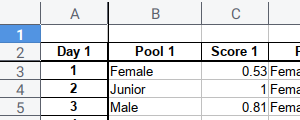
This script just displaying value of cells, and nothing more.
import openpyxl
from openpyxl import load_workbook
wb = load_workbook('combined.xlsx')
ws = wb["Combined"]
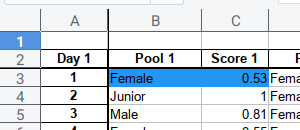
b3 = ws['B3']
c3 = ws['C3']
print(b3.value)
print(c3.value)With the result similar to below:
Female
0.53
Formatting Cell Style
We can go further by altering the style.
from openpyxl.styles import Color, PatternFill, Font, Border
redFill = PatternFill(
start_color='FFFF0000',
end_color='FFFF0000',
fill_type='solid')
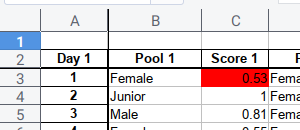
ws['c3'].fill = redFillSaving Workbook
And do not forget to store the file somewhere.
# Save the file
wb.save("sample.xlsx")
The result of the sheets will be as below:
Color Library
Since we deal with gradient of color, we should prepare the color. There are a few option, ranging from open color, to google material color.
Percentage Reasoning
My choice comes to Material color, because it has scale range from 100 to 900. with additional 50 that we can use. Perfect for percentage scale from zero to a hundred percent.
The Script Module
I already write all colors,
but for learning purpose,
I need the code to be short.
So I only write three colors here: blue, lime and green.
from openpyxl.styles import Color, PatternFill, Font, Border

blueScale = {
  0: 'FFE3F2FD',
  1: 'FFBBDEFB',
  2: 'FF90CAF9',
  3: 'FF64B5F6',
  4: 'FF42A5F5',
  5: 'FF2196F3',
  6: 'FF1E88E5',
  7: 'FF1976D2',
  8: 'FF1565C0',
  9: 'FF0D47A1'
}

limeScale = {
  ...
}

greenScale = {
  ...
}

blueScaleFill  = {}
limeScaleFill  = {}
greenScaleFill = {}

for key, value in blueScale.items():
  blueScaleFill[key] = PatternFill(
    start_color=value,
    end_color=value,
    fill_type='solid')

for key, value in limeScale.items():
  ...

for key, value in greenScale.items():
  ...
Conditional Coloring
Now we can format cell according to, the conditional state of the cell.
Importing Library
We need to import the color library first
import openpyxl
import math
from openpyxl import load_workbook
from mycolors import blueScaleFill, limeScaleFill, greenScaleFill
Getting Color Scale
Now we can format cell according to, the conditional state of the cell.
wb = load_workbook('combined.xlsx')
ws = wb["Combined"]

b3 = ws['B3']
c3 = ws['C3']

pred = b3.value
prob = c3.value
colScale = math.floor(prob*10)
Notice that we have these two lines:
- The Prediction.
- The Probability.
pred = b3.value
prob = c3.value
From this probability value, we can convert the gradient scale of the material color.
colScale = math.floor(prob*10)Getting Color Scale
Now we can test our conditional for these two cells.
Using only prediction column, and probability column.
if pred=='Female':
  ws['B3'].fill = blueScaleFill[colScale]
  ws['C3'].fill = blueScaleFill[colScale]
elif pred=='Male':
  ws['B3'].fill = limeScaleFill[colScale]
  ws['C3'].fill = limeScaleFill[colScale]
elif pred=='Junior':
  ws['B3'].fill = greenScaleFill[400]
  ws['C3'].fill = greenScaleFill[400]
elif pred=='Juvenile':
  ws['B3'].fill = greenScaleFill[300]
  ws['C3'].fill = greenScaleFill[300]
elif pred=='Puppy':
  ws['B3'].fill = greenScaleFill[200]
  ws['C3'].fill = greenScaleFill[200]
The result
As usual, do not forget to store the good result as a file somewhere.
# Save the file
wb.save("sample.xlsx")
Now we can highlight the first row of data with the right color as figure below:
We should see the difference between gradient, as we have more row of data.
Applying Color to Range of Rows
After testing for one record, we can utilize the code above to color many rows.
Main Code
The main code is simple. The loop walk each row.
We define the range manually, for example from first row to the 650th row.
# ... some header and initialization

def color_me(row, name_pred, name_prob):
  # ... some code

rows = range(1, 650)
for row in rows:
  color_me(row, 'B', 'C')
  color_me(row, 'D', 'E')
  color_me(row, 'F', 'G')

# Save the file
wb.save("sample.xlsx")
Each loop calls the color_me function three times.
Each for different column.
The Color Me Function
We should make the function, flexible enough to handle any column. The generic function is as below code:
def color_me(row, name_pred, name_prob):
  column_pred = ws[name_pred+str(row)]
  column_prob = ws[name_prob+str(row)]

  pred = column_pred.value
  prob = column_prob.value

  if not (type(prob) == int or type(prob) == float): return
  colScale = math.floor(prob*10)

  # ... conditional formatting below
Generic Conditional Code
Now the formatting can also be generic:
  if pred=='Female':
    column_pred.fill = blueScaleFill[colScale]
    column_prob.fill = blueScaleFill[colScale]
  elif pred=='Male':
    column_pred.fill = limeScaleFill[colScale]
    column_prob.fill = limeScaleFill[colScale]
  elif pred=='Junior':
    column_pred.fill = greenScaleFill[4]
    column_prob.fill = greenScaleFill[4]
  elif pred=='Juvenile':
    column_pred.fill = greenScaleFill[3]
    column_prob.fill = greenScaleFill[3]
  elif pred=='Puppy':
    column_pred.fill = greenScaleFill[2]
    column_prob.fill = greenScaleFill[2]
Handling None Value
You should aware ther presence of this code below:
if not (type(prob) == int or type(prob) == float): returnWhen the probability is not a number,
the entire line would be ignored,
because the return statement would exit the function.
This means when we encounter empty white cells,
that have None value.
This line will be also ignored.
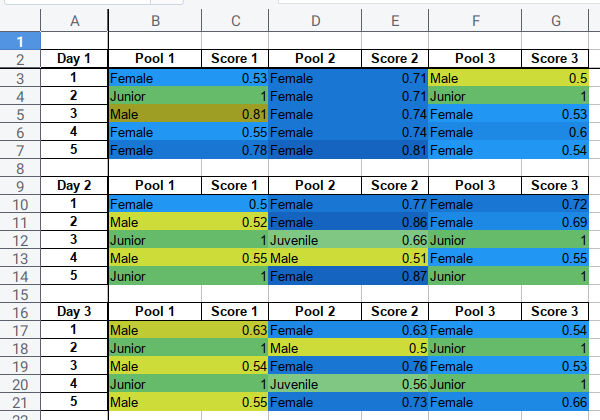
The Result
Finally we have peace, with complete coloring.
This is very useful for processing hundred of rows.
Conclusion
We are done. That is all. Thank you for reading.
What do you think?