Preface
Goal: Transform data with Panda’s dataframe, from plain table to pivot.
I enjoy geekily transforming data using list comprehension. However, when it comes to real-world problem-solving, a more straightforward method is often necessary, one that won’t overwhelm beginners.
Something that won’t cause beginner too much headache.
Managing Local Library
Naming Space
For tutorial purposes, I organize the development process gradually. For example:
├── 11-pandas.py
├── 12-model-view.py
├── 13-pivot.py
├── 14-writer.py
├── 15-deco.py
├── 16-pivot.py
├── 17-reader.py
├── 18-reader-writer.py
I name the files for the classes,
with the same number as the main file.
In this case for 11-pandas.py I have these two files:
lib/TableSample11.pylib/PivotSample11.py
.
├── 11-pandas.py
└── lib
    ├── PivotSample11.py
    └── TableSample11.py
However, the classes inside the files have no numbers. In this case, the class names are:
class TableSample:class PivotSample:
Now, I can call the local library as below:
from lib.TableSample11 import TableSample
from lib.PivotSample11 import PivotSample
When the class became mature and can be shared along multiple script, I remove the number, for example:
lib/TableSample.pylib/PivotSample.py
with shared class, I can avoid too maintaining too many classes.
Transformation Abstraction
We can envision the data morphing, through a diagram and simple statements.
The Data Set
The raw data set can be represented as:
The Operations
Even with Pandas library, we can capture the essence of the operations in a more abstract form.
- Obtaining the Pivot, with a magical panda function.
- Creating a new index, for sorting later, based on date/time.
- Sorting by the result, using new index.
Now we are ready for the actual code.
Morphism Diagram
We can also visualize the process as below:
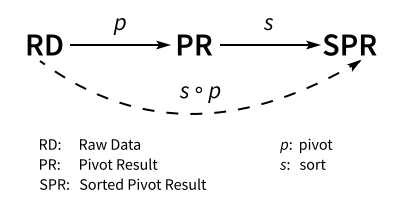
This diagrammatic algebra is a simplified diagram, without considering reindexing using datetime parameter, while sorting the pivot result.
Simple CSV Reader
Let’s begin with a straightforward process, by reading the CSV and importing it into a dataframe at once.
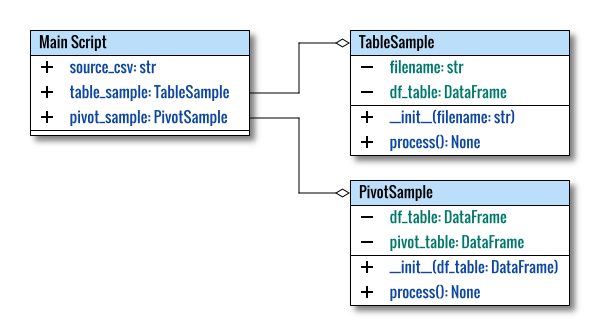
The class structure might seem complex, but the actual code is concise.
Directory Structure
We are also going to organize the class in its own lib directory.
.
├── 11-pandas.py
└── lib
    ├── PivotSample11.py
    └── TableSample11.py
Main Script
I prefer to keep the main script short. Long scripts tend to be messy, and with a shorter main script, I can manage the flow better without losing focus.
The class skeleton is as follows:
#!/usr/bin/env python3

# Local Library
from lib.TableSample11 import TableSample
from lib.PivotSample11 import PivotSample

def main() -> None:
  source_csv = 'sample-data.csv'

  table_sample = TableSample(source_csv)
  table_sample.process()

  pivot_sample = PivotSample(table_sample.df_table)
  pivot_sample.process()

if __name__ == "__main__":
  main()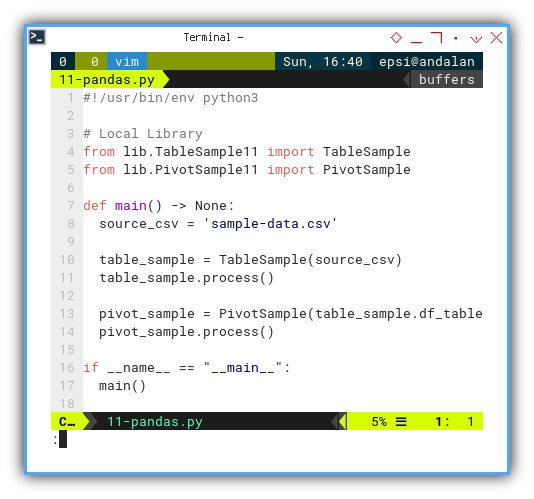
I use table_sample.df_table property,
as a feed to pivot class instance.
Table Sample Class
The simple TableSample class is concise,
and quite self-explanatory.
import pandas as pd
from pandas import DataFrame

class TableSample:
  def __init__(self, filename: str) -> None:
    # save initial parameter
    self.filename = filename

  def process(self) -> None:
    # Load data into a DataFrame
    self.df_table = pd.read_csv(self.filename)

    # Display the header
    print("Header:", self.df_table.columns)

    # Display the data
    print("Data:")
    print(self.df_table)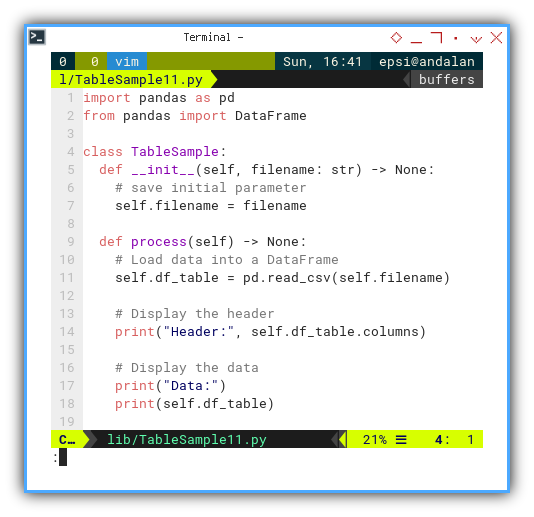
With the result as shown below:
❯ ./11-pandas.py
Header: Index(['Number', 'Date', 'Fruit'], dtype='object')
Data:
     Number        Date       Fruit
0         1  19/02/2017      Orange
1         2  19/02/2017       Grape
2         3  19/02/2017  Strawberry
3         4  19/02/2017      Orange
4         5  19/02/2017       Apple
..      ...         ...         ...
750     751  05/04/2017  Strawberry
751     752  05/04/2017  Strawberry
752     753  05/04/2017       Mango
753     754  05/04/2017  Strawberry
754     755  05/04/2017      Banana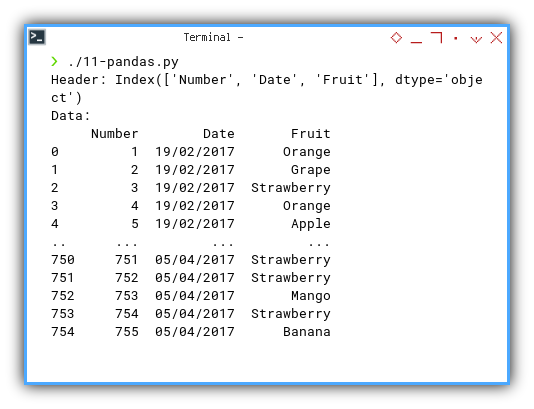
Just keep an eye on the index. We will manipulate with the index later.
Pivot Sample Class
The simple PivotSample class is also succint.
import pandas as pd

from datetime import datetime
from pandas import DataFrame

class PivotSample:
  def __init__(self, df_table: DataFrame) -> None:
    # save initial parameter
    self.df_table = df_table

  def process(self) -> None:
    # Perform pivot operations, for example:
    pivot_table = self.df_table.pivot_table(
      index='Date', columns='Fruit',
      aggfunc='count', fill_value=0)

    # Sort the index by both month and day
    pivot_table.index = pivot_table. \
      index.to_series().apply(lambda x:
        datetime.strptime(str(x), "%d/%m/%Y"))
    self.pivot_table = pivot_table.sort_index()

    print("Pivot Table:")
    print(self.pivot_table)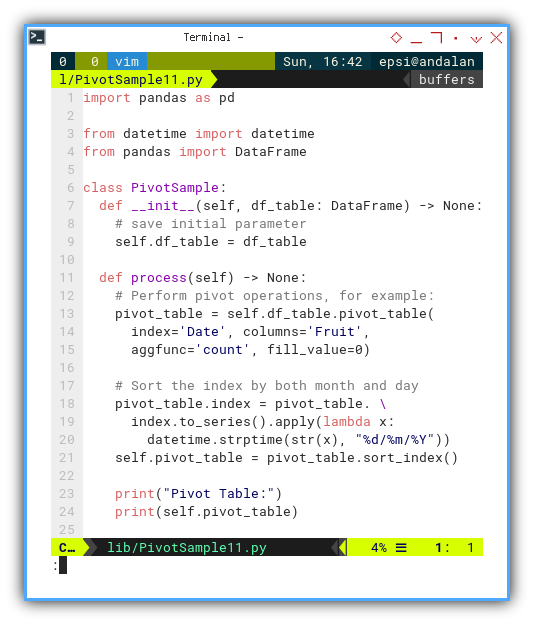
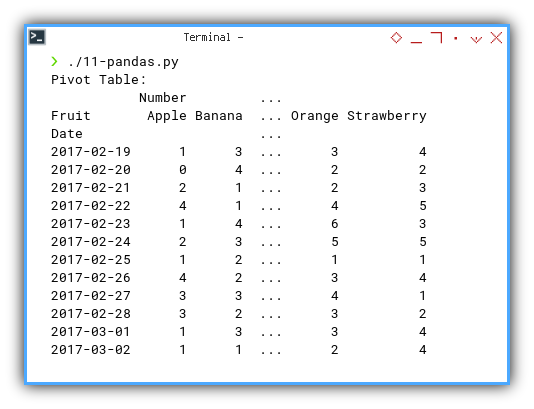
With the result as shown below:
❯ ./11-pandas.py
Pivot Table:
Number ...
Fruit Apple Banana ... Orange Strawberry
Date ...
2017-02-19 1 3 ... 3 4
2017-02-20 0 4 ... 2 2
2017-02-21 2 1 ... 2 3
2017-02-22 4 1 ... 4 5
...
...
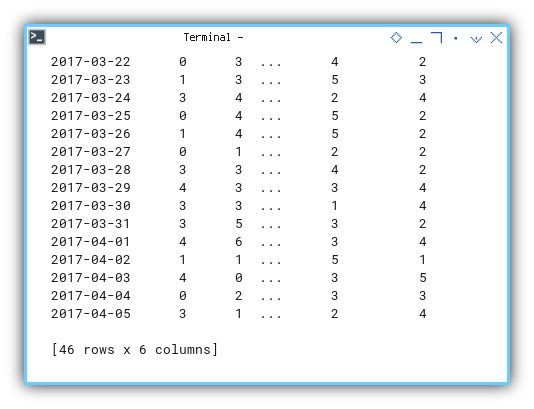
2017-04-02 1 1 ... 5 1
2017-04-03 4 0 ... 3 5
2017-04-04 0 2 ... 3 3
2017-04-05 3 1 ... 2 4
[46 rows x 6 columns]It is going to display a significant amount of data.
And so on… continue…
If you prefer, you can also keep an eye of the index,
using self.pivot_table.columns.
Header: MultiIndex([('Number',      'Apple'),
            ('Number',     'Banana'),
            ('Number',      'Grape'),
            ('Number',      'Mango'),
            ('Number',     'Orange'),
            ('Number', 'Strawberry')],
           names=[None, 'Fruit'])
How does it works?
How is the data transformed behind the scene? It is easier to understand, by examininging how the data evolves.
First, we utilize the built-in pivot maker from the dataframe.
    # Perform pivot operations, for example:
    pivot_table = self.df_table.pivot_table(
      index='Date', columns='Fruit',
      aggfunc='count', fill_value=0)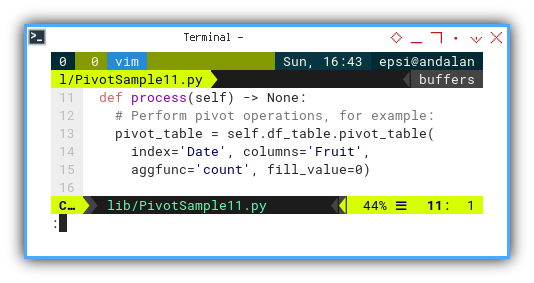
This results in a grouped but unsorted date, as shown below:
❯ ./11-pandas.py
Pivot Table:
           Number         ...
Fruit       Apple Banana  ... Orange Strawberry
Date                      ...
01/03/2017      1      3  ...      3          4
01/04/2017      4      6  ...      3          4
02/03/2017      1      1  ...      2          4
02/04/2017      1      1  ...      5          1
03/03/2017      1      4  ...      5          2
03/04/2017      4      0  ...      3          5
04/03/2017      1      3  ...      0          4
04/04/2017      0      2  ...      3          3
05/03/2017      1      4  ...      4          4
05/04/2017      3      1  ...      2          4
06/03/2017      5      2  ...      3          2
07/03/2017      4      2  ...      3          2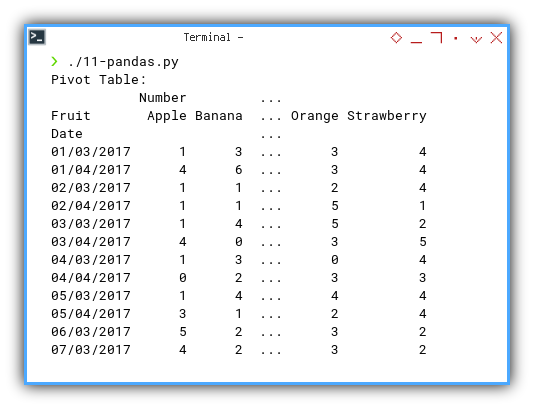
The actual index is:
❯ ./11-pandas.py
Pivot Table:
Index(['01/03/2017', '01/04/2017', '02/03/2017', '02/04/2017', '03/03/2017',
       '03/04/2017', '04/03/2017', '04/04/2017', '05/03/2017', '05/04/2017',
       '06/03/2017', '07/03/2017', '08/03/2017', '09/03/2017', '10/03/2017',
       '11/03/2017', '12/03/2017', '13/03/2017', '14/03/2017', '15/03/2017',
       '16/03/2017', '17/03/2017', '18/03/2017', '19/02/2017', '19/03/2017',
       '20/02/2017', '20/03/2017', '21/02/2017', '21/03/2017', '22/02/2017',
       '22/03/2017', '23/02/2017', '23/03/2017', '24/02/2017', '24/03/2017',
       '25/02/2017', '25/03/2017', '26/02/2017', '26/03/2017', '27/02/2017',
       '27/03/2017', '28/02/2017', '28/03/2017', '29/03/2017', '30/03/2017',
       '31/03/2017'],
      dtype='object', name='Date')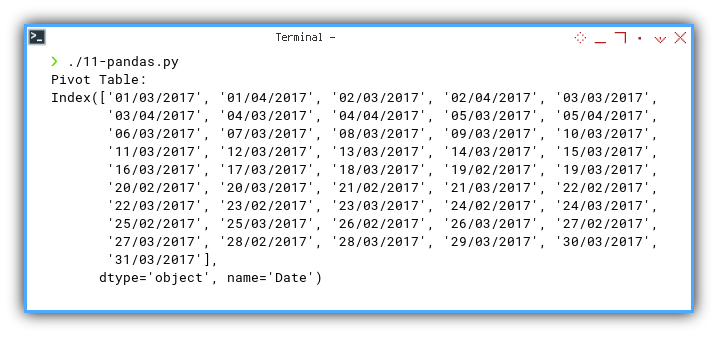
With the help of lambda, strptime, and friendly spirit.
we can sort the dataframe by date.
    # Sort the index by both month and day
    pivot_table.index = pivot_table. \
      index.to_series().apply(lambda x:
        datetime.strptime(str(x), "%d/%m/%Y"))
    self.pivot_table = pivot_table.sort_index()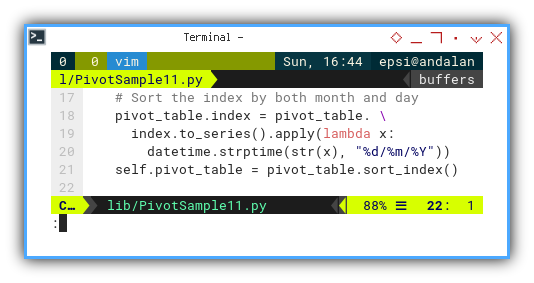
❯ ./11-pandas.py
Pivot Table:
DatetimeIndex(['2017-02-19', '2017-02-20', '2017-02-21', '2017-02-22',
               '2017-02-23', '2017-02-24', '2017-02-25', '2017-02-26',
               '2017-02-27', '2017-02-28', '2017-03-01', '2017-03-02',
               '2017-03-03', '2017-03-04', '2017-03-05', '2017-03-06',
               '2017-03-07', '2017-03-08', '2017-03-09', '2017-03-10',
               '2017-03-11', '2017-03-12', '2017-03-13', '2017-03-14',
               '2017-03-15', '2017-03-16', '2017-03-17', '2017-03-18',
               '2017-03-19', '2017-03-20', '2017-03-21', '2017-03-22',
               '2017-03-23', '2017-03-24', '2017-03-25', '2017-03-26',
               '2017-03-27', '2017-03-28', '2017-03-29', '2017-03-30',
               '2017-03-31', '2017-04-01', '2017-04-02', '2017-04-03',
               '2017-04-04', '2017-04-05'],
              dtype='datetime64[ns]', name='Date', freq=None)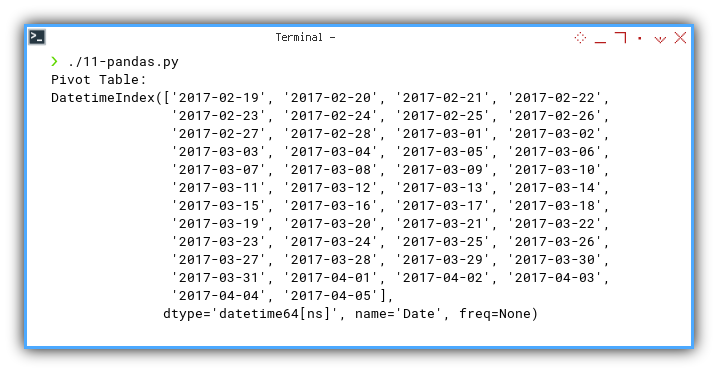
This forms the foundation of our pivot table.
What’s Our Next Move 🤔?
From simple dataframe, we can continue to custom dataframe, such as adding custom total column and custom total row. We will learn to access the matrix cell inside the dataframe using index.
After exploring the simple dataframe, we can proceed to a custom dataframe, incorporating features like adding custom total columns and custom total rows. We will delve into accessing matrix cells within the dataframe using indices.
Consider continuing to read [ Pivot - Model - Custom Class ].