Preface
Goal: An overview of custom pivot table, from data modelling to spreadsheet.
This is a multipart article:
- Modelling data with list comprehension vs dataframe.
- Generate Excel files using the result with OpenPyXL.
- Automate LibreOffice Calc using the result with Python Macro.
Why a Case?
The Quest for Simple Data Modeling
I always ask myself why I do such things. Am I just did learn random subject without a cause, or does my subconscience aim for something bigger than life? The thing is, I always caught myself does simple stuff deeply, so I can step up harder topic. I just want to be well prepared.
I would like to step learning into statistic, and I think I have to be proficient in some area, from spreadsheet, dataframe, to visualization.
Data processing is always intriguing. I haven’t got a good case, until I met this simple Excel task, the pivot table.
Why Pivot?
Not to simple. Not to complex.
I’m delving into sheet reading and writing, and a pivot requires both a data source and a target sheet, making it an ideal example. It’s a sweet spot for showcasing the functionality.
I sweat my brain after working hours to finish this case example, so you don’t have to struggle so much. You can report your summary quicker, using this custom tailor-made script.
Checking Result?
You can compare directly.
Both Excel and Calc excel can effortlessly executing various types of pivots. We can also add additional column that do not below to the original table. So if all you need is just an ordinary Pivot table, this article is simply not for you.
However, if your goal is to arm yourself with a readily applicable dataframe that can be seamlessly represented in a spreadsheet, this case example is tailored to expedite your learning process.
Consider this pivot as just a case to explore. A noteworthy one. Not to simple. Not to complex. You can also conduct direct comparisons, head to head with the result of Excel/Calc version.
Why Choose Python over VBA?
Allow me to share my subjective opinions on this matter:
-
Ease of Use: Python stands out for its user-friendly nature, and the extensive community support ensures that help is readily available when needed.
-
Integration Capabilities: The seamless integration with Python libraries, such as Pandas, adds a layer of versatility to the language, making it a powerful choice for data manipulation tasks.
-
Familiarity with LibreOffice: With over a decade of experience as a LibreOffice user, the familiarity and comfort level with the platform make Python a natural extension for scripting tasks within LibreOffice environments.
Exploring Various Pivot Cases
Addressing a Range of Scenarios with a Practical Example
Python Source Code
For convenience, I share the script along with the example data.
For your convenience, I’m providing the script alongside illustrative example data.
openPyXL
LibreOffice Macro
Real World Dilemma
The challenge with creating examples lies in the myriad of use cases, No example fits all real-world scenarios.
Consider a colleague who needs data from a spreadsheet they’ve created a business partner requesting data from a CSV generated by their IT department, and a tech-savvy friend who leans towards list comprehension instead of a dataframe.
Recognizing the demand for swift solutions, I’ve opted to cover most permutations. By doing so, these article series aim to serve as a comprehensive resource. Whether your requirement aligns with one of the provided examples or requires a bit of customization, these articles intend to offer a working foundation for various scenarios.
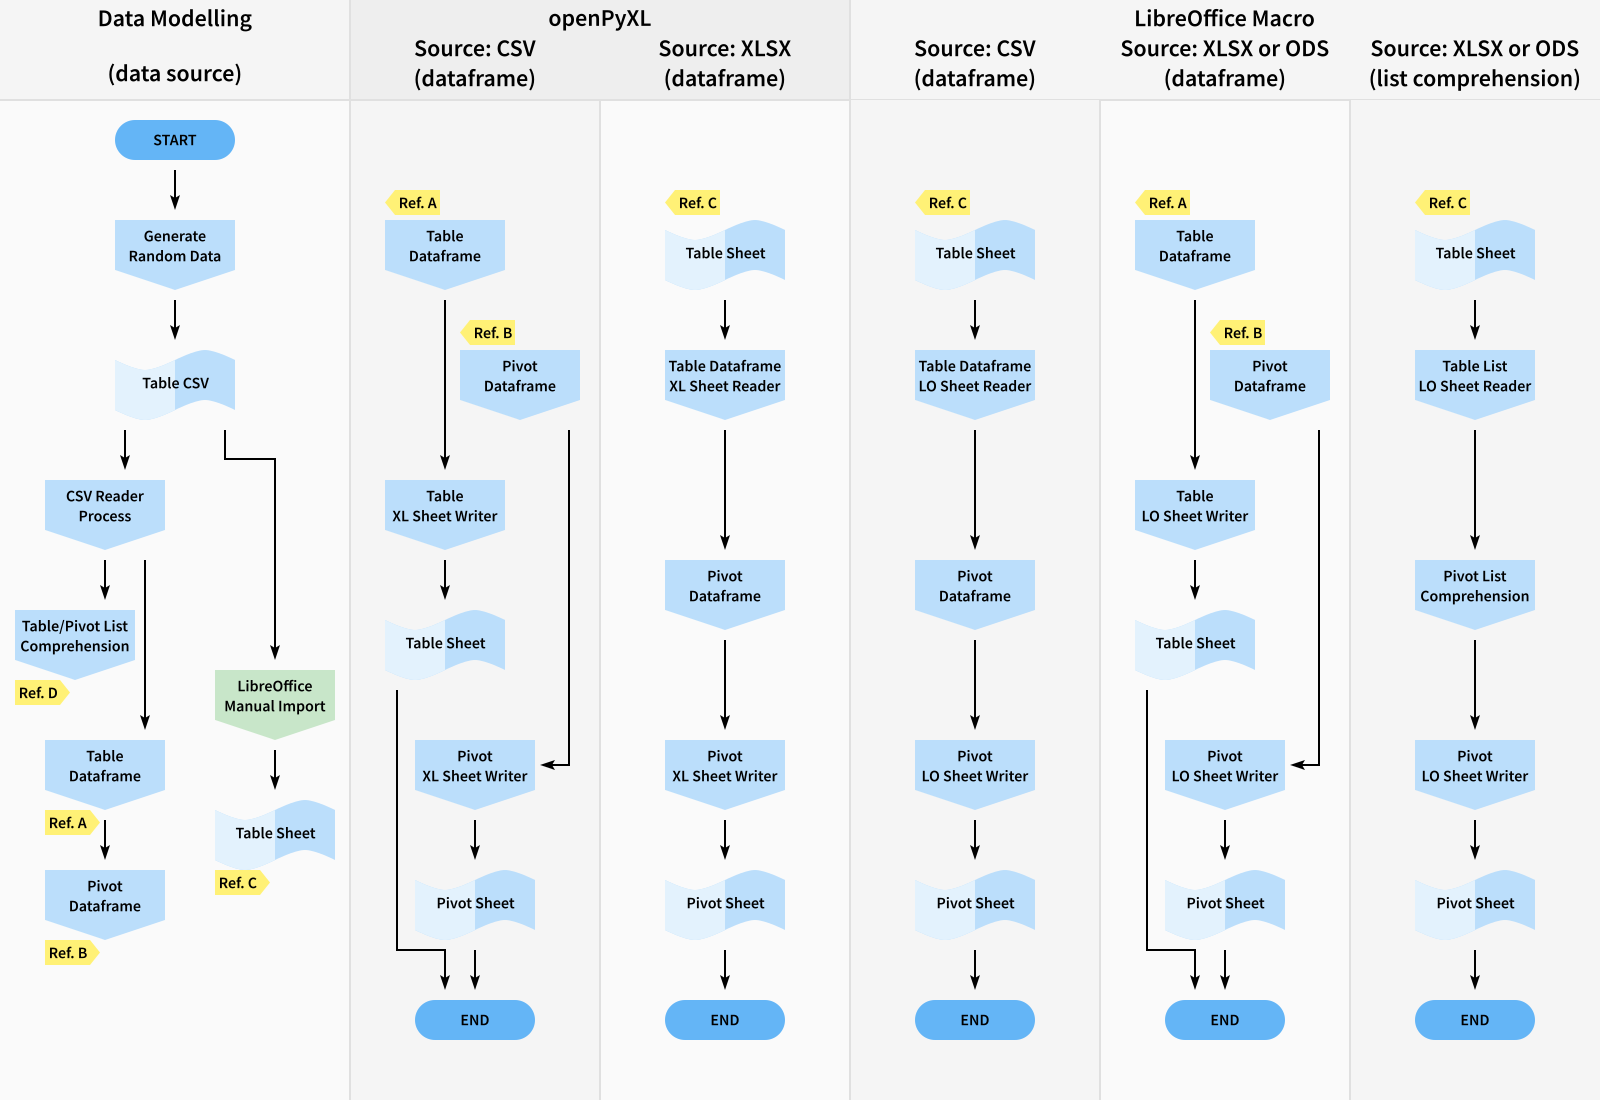
The SVG version of the above image is available here:
Data Generator
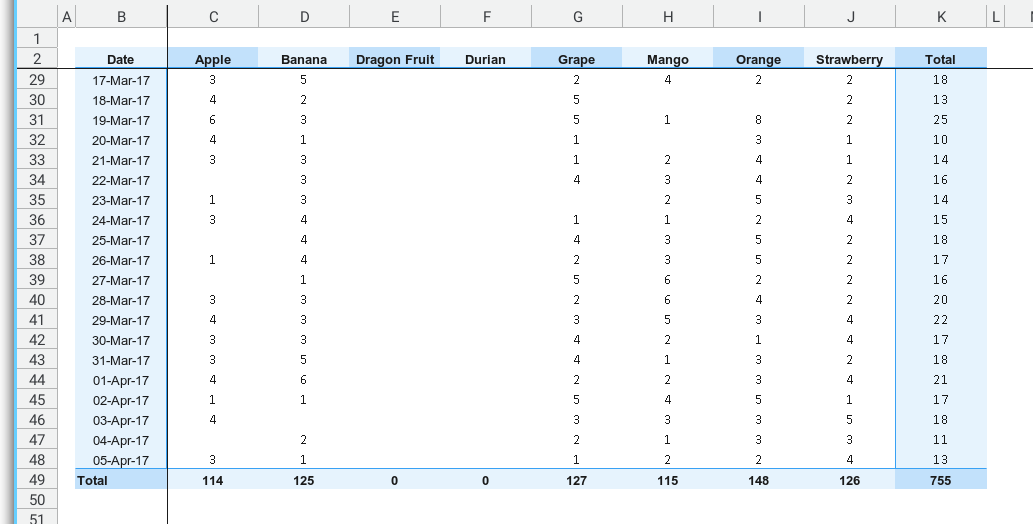
Before delving into the specifics, let’s secure some example data. I’ve opted for the CSV format, and a script is available to generate random data in this format.
Once the example data is generated, you can review the raw data using a text editor. Alternatively, open the CSV file in Excel or Calc, and you have the flexibility to save it as an XLSX or ODS file for more advanced processing.
Now, equipped with our dataset, we can seamlessly transition into the realm of data modeling.
Data Modelling
I’ve formulated two distinct approaches to data modeling:
- List Comprehension
- Dataframe
Our next step involves a meticulous comparison of each approach against the results generated by the pivot in Excel/Calc. This comparative analysis is essential for minimizing errors before we proceed to write the final results to the spreadsheet. Let’s ensure a seamless alignment between our Python-based approaches and the benchmark set by Excel/Calc’s pivot functionality.
Target Library
While I personally favor LibreOffice Calc, I understand that others might lean towards Microsoft Excel. And worst, they don’t even know how to install LibreOffice on their computer. To accommodate different preferences, I provide two choices:
-
openPyXL For those who prefer working with Excel files using Python scripts.
-
LibreOffice Macro/ Uno/ Ooo Dev: Tailored for users already utilizing LibreOffice.
If neither script for Excel files nor LibreOffice Macro aligns with your requirements, then this article series is simply not for you. You should go somewhere else, and don’t bother for asking me for spreadsheet help for free ever again.
In that case, seeking assistance elsewhere for spreadsheet-related queries is recommended, as the focus here is on leveraging these specific libraries for Python scripting.
For both the case and approaches, we encounter the following permutations:
-
Case 1: openPyXL, Source from CSV
-
Case 2: openPyXL, Source from spreadsheet sheet
-
Case 4: LibreOffice Macro/ Uno/ Ooo Dev, Source from spreadsheet sheet
-
Case 4: LibreOffice Macro/ Uno/ Ooo Dev, Source from CSV
Given the presence of two approaches, I’m introducing a bonus case:
- Case 5: LibreOffice Macro, Source from spreadsheet sheet, Utilizing list comprehension list comprehension
While the last case may not be explicitly included in the article, rest assured that the source code will provide the necessary details for this additional scenario.
Case 1: openPyXL, Dataframe, CSV
Python Script
Utilizing CSV as the data source:
-
Generate a table dataframe from the CSV, and write it to the example
Tableworksheet. -
Construct a pivot dataframe based on the table dataframe, and write it to the
Pivotworksheet.
Resultant sheets: Table and Pivot
Case 2: openPyXL, Dataframe, Sheet
Python Script
Utilizing the Table sheet as data source:
-
Read the
Tableworksheet, and create a table dataframe based on this sheet, -
Construct a pivot dataframe based on the table dataframe, and write it to the
Pivotworksheet.
Source sheet: Table
Resultant sheet: Pivot
Case 3: LibreOffice Macro, Dataframe, Sheet
Python Macro
Utilizing the Table sheet as data source:
-
Read the
Tableworksheet, and create a table dataframe based on this sheet, -
Construct a pivot dataframe based on the table dataframe, and write it to the
Pivotworksheet.
Source sheet: Table
Resultant sheet: Pivot
The process closely mirrors the second case with openPyXL.
Case 4: LibreOffice Macro, Dataframe, CSV
Python Macro
Utilizing CSV as data source:
-
Generate a table dataframe from the CSV, and write it to the example
Tableworksheet. -
Construct a pivot dataframe based on the table dataframe, then write to the
Pivotworksheet.
Resultant sheets: Table and Pivot
The process also closely mirrors the first case with openPyXL.
Case 5: LibreOffice Macro, List Comprehension, Sheet
Python Macro
Alright, I understand! You’ve just mastered list comprehension, and find joy in low-level data modeling. However, I believe there’s no need to include this in the article. Nonetheless, you can access the example in the source code.
On Statistics
Tale of Two Ends
Statistics has been in a middle chain of my learning journey.
On the high-end spectrum, delving into Artificial Intelligence (AI) or Machine Learning (ML) is a primary goal. The stepping stone to AI/ML lies in the realm of Data Science, a field that demands a foundational understanding of programming and mathematics, ranging from linear algebra and calculus to certain topics in statistics.
On the low-profile side, I observe the evolution of modern statistics. The contemporary landscape allows us to leverage spreadsheet tools, script/macro automation, and sophisticated visualization techniques.
As a starting point, my focus will be on four key tasks
-
Spreadsheet: A dedicated article on this topic is available on my other blog in Bahasa Indonesia.
-
Script/Macro automation: This very blog is dedicated to exploring this facet.
-
Visualization: There’s still much for me to learn in this area.
-
Statistics: The foundation is already in my mind, though finding time to put it into writing remains a challenge.
I simply haven’t got time to write.
The Journey
Bridging The Gap
I respect people who admit their lack of knowledge.
Now you know what I don’t know. I’ll share what I do know through article series, and I’m committed to learn what I currently don’t understand, as long as it’s relevant. Admittedly, there are many things I have yet to grasp fully.
I hold a deep respect for individuals who openly acknowledge their gaps in knowledge. Such individuals not only recognize their areas of ignorance but likely comprehend the journey I’m undertaking.
The pivot topic might not immediately strike as fascinating, given its familiarity in Excel/Calc. However, for those who grasp the potential of automation, this article series may be viewed through a different lens. Statistics may seem mundane until you witness the transformative power, like creating your own custom face recognition system.
Nevertheless, this is merely another prerequisite in a larger challenge I currently face. Making these articles interesting isn’t my primary goal, rather I strive to be thoroughly prepared for what lies ahead.
I just want to be prepared.
Walking Together
The dilemma I face while writing is the inherent trade-off in the short term. This significantly slows down my learning process. Writing articles demands time that could otherwise be spent learning something new.
However, there are key reasons for persisting in this approach:
-
Practical Usefulness: What I write tends to become practically useful over the long term, integrating into daily workflows. Adopting new tricks into our routines takes time and maturity, as one concept seamlessly connects to another.
-
Reasoning Purpose: I completely forget, my reasoning purpose. So let’s skip this point.
-
Empowering the Team: Despite the slowdown in my individual learning, the documentation may empower my team, fostering collaboration over an extended period. If it proves useful to others, the reciprocal feedback received later becomes a valuable asset.
What Comes Next 🤔?
Whether you’re a student or an employee, having scripts or macros at your disposal can be immensely beneficial. Sure it’s going to be a long ride, and we can’t postpone our journey any longer.
Our first step will involve generating random example data, a task that will lay the foundation for the entire article series.
Let’s dive into the process and make the most of this learning adventure by reading [ Pivot - Model - Data Generator ].