Preface
Goal: Realtime data plot using Pandas.
I’ve been wondering what if I can simulate sensor data and show the realtime in the same manner with real device such as thermocouple. So I’m thinking about generating random data, with adjustable feature, so I can reach any temperature that I want.
Then publish the data using MQTT topic just like what device does, subscribe the topic using other script, and finally plot the realtime data using time series in panda.
How to Achieve
We can start with
- Generating Random Data.
- Pack the result in a dataframe.
- Plot dataframe in Matplotlib.
- Plot in time series fashioned.
Then we can discuss about other step.
- Publishing adjustable random data using MQTT.
- Subscribe MQTT in time series.
- Plot realtime data as moving lines.
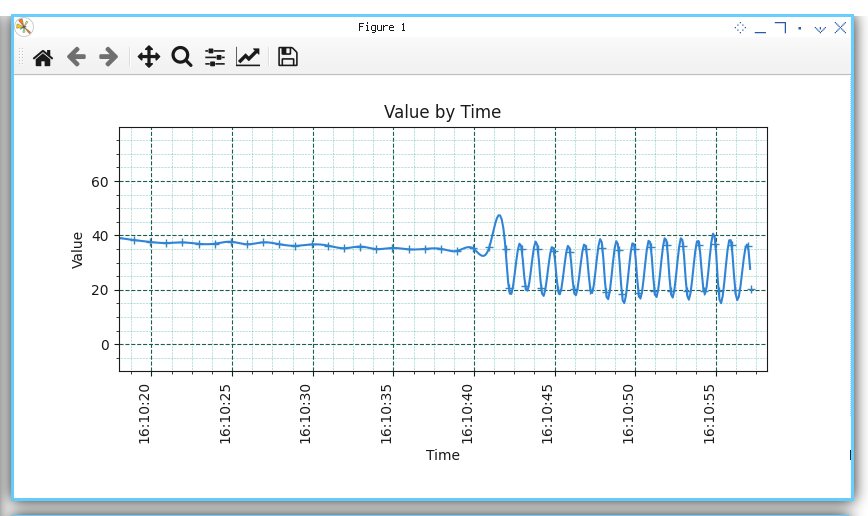
This video should give you an overview, about result what we want to achieve.
1: Generating Moving Numbers
Cheap Sensor Simulator
All we have to do is having number with small random changes, one number after the other. So we can have line like chart plot later.
Python Source Code
For convenience, I share the script.
Required Package
We only need numpy so we can print array with precision later.
import numpy as np
import random
from time import sleep
Skeleton
The skeleton is simple. It is only consist one constructor, one method to update number, and one main method.
class rndGenerator:
  def __init__(self):
  def update_num(self):
  def __call__(self):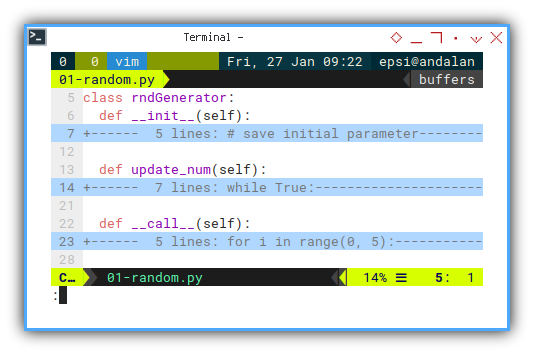
Constructor
Imagine that our device has room temperature sensor, in a beach in a tropical island. The room can’t be cooler than five celcius degree, and the room also can’t be too hot, more than fourty celcius degree.
class rndGenerator:
  def __init__(self):
    # save initial parameter
    self.lim_lower  =  5
    self.lim_upper  = 40
    self.num_normal = 21
    self.current    = self.num_normal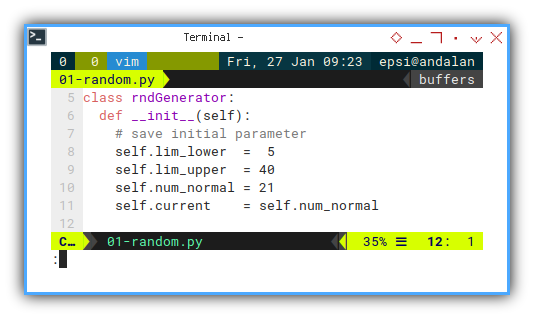
We also have initial value as twenty one celcius degree. Because our room have a good air conditioner.
Random Update
More fluctuation, so we can examine better
Now we can change the temperature as below. The temperatur will follow previous value.
new_temp = new_temp + random.uniform(-1, 1)The issue with that code, is the the fluctuation is not enough to be observed by human eye. Since we want to differ the temperatur shift manually. We need to have more bigger change range.
  def update_num(self):
    while True:
      neo = self.current
      neo += random.uniform(-5, 5)
      if self.lim_lower <= neo <= self.lim_upper:
        break

    self.current = neo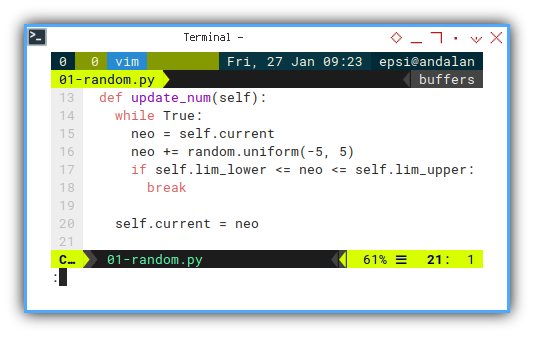
We also guard the result, so the temperature won’t pass our limit constraint.
Main
Call directly
Now we can generate as many number as we want.
  def __call__(self):
    for i in range(0, 5):
      self.update_num()
      print("%.2f" % self.current)
      yield self.current
      sleep(0.2)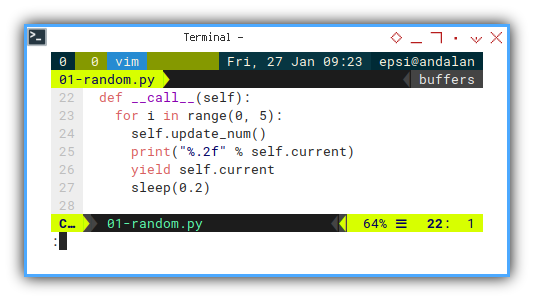
Execute: Run
We need to creta clas instance first, then just run the method. And finally print the result.
rndGen = rndGenerator()
numbers = np.array(list(rndGen()))

np.set_printoptions(precision=2)
print(numbers)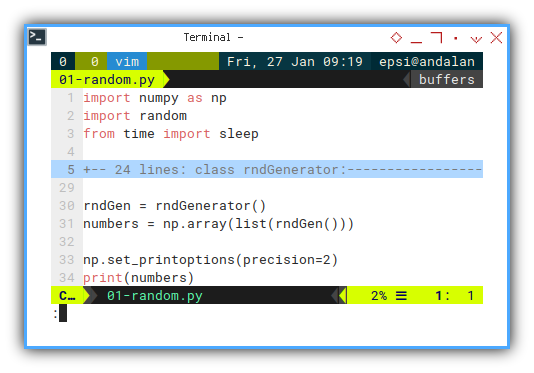
Examine Result in CLI
Command Line Interface
We can examine the result as below:
❯ python 01-random.py19.60
19.58
15.70
15.39
10.88
[19.6 19.58 15.7 15.39 10.88]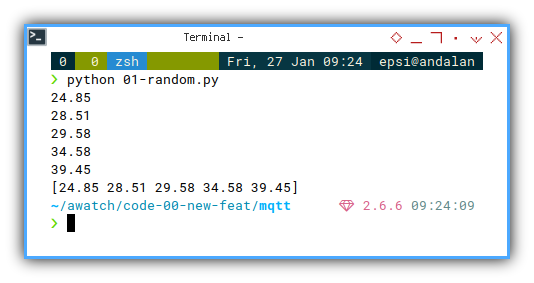
2: Packing to Dataframe
We generate number in a loop. And for each item in the loop, we add the data into dataframe series.
Python Source Code
The script is available, so you can just copy-paste-examine-run.
Required Package
We need panda to use dataframe.
import pandas as pd
import numpy as np
import random

from time import sleep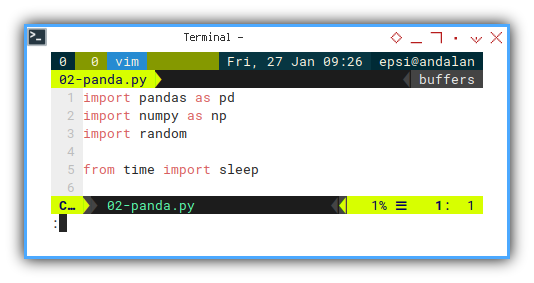
Skeleton
We have additional update_data method.
class rndGenerator:
  def __init__(self):
  def number_setup(self):
  def update_num(self):
  def update_data(self):
  def __call__(self):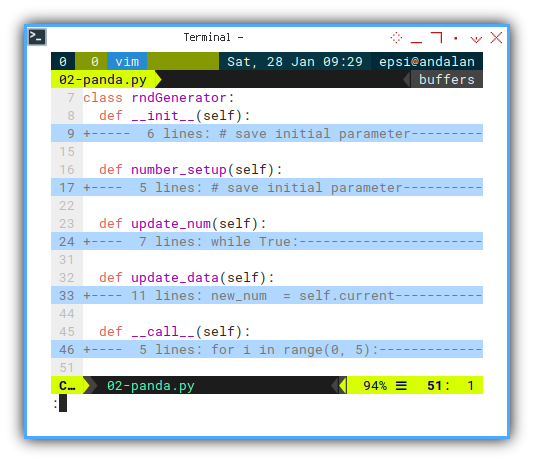
Constructor
We pack list of data series with the same length in dataframe.
class rndGenerator:
  def __init__(self):
    # save initial parameter
    self.index = 0
    self.timeframe = pd.DataFrame({
      "time": [], "temp": []  })

    self.number_setup()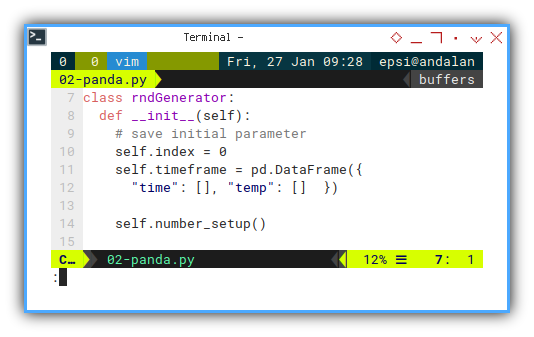
Setup Number
The same initial setup as previous.
Update Number
The same update method as previous.
Append Data Frame
We can append a time frame by using concat:
    self.timeframe = pd.concat(
      [self.timeframe, new_pair])
Update Data Frame
And here the additional method. For each new number, we pack into pair.
And then append each pair into the dataframe.
  def update_data(self):
    new_num  = self.current
    new_time = pd.Timestamp.now()

    new_pair = pd.DataFrame({
      "time": new_time,
      "temp": new_num
    }, index=[self.index])

    self.index += 1
    self.timeframe = pd.concat(
      [self.timeframe, new_pair])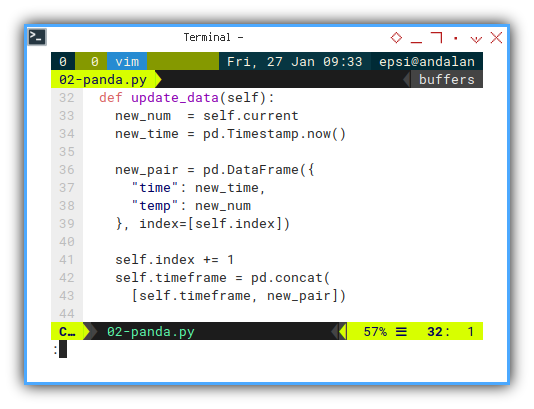
Now we have time series.
Main
Do not forget to update data frame, in the loop in the main method.
  def __call__(self):
    for i in range(0, 5):
      self.update_num()
      self.update_data()

    return self.timeframe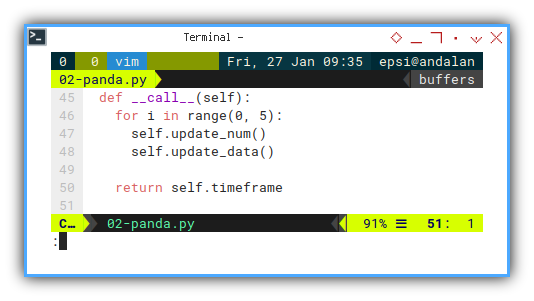
Execute: Run
The run
np.set_printoptions(precision=2)
rndGen = rndGenerator()
print(rndGen())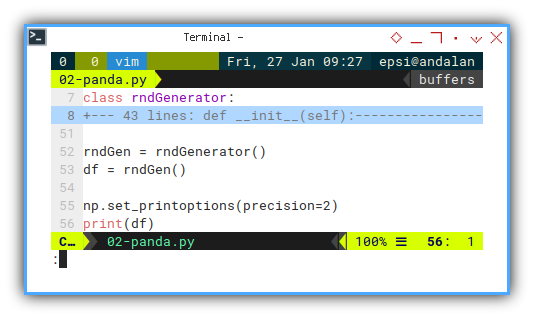
Output in CLI
The numpy output is very nice.
❯ python 02-panda.py time temp
0 2023-01-28 09:23:32.145785 21.924042
1 2023-01-28 09:23:32.147596 21.968360
2 2023-01-28 09:23:32.148587 24.703646
3 2023-01-28 09:23:32.149539 29.576014
4 2023-01-28 09:23:32.150507 27.768895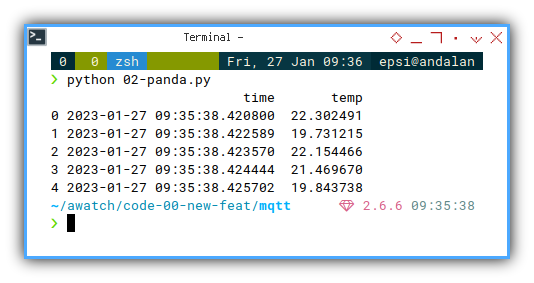
What is Next 🤔?
We are ready with data frame. Now we are ready to plot the data frame.
Consider continue reading [ Python - Panda - Plot Series ].