Preface
Goal: Realtime data plot using Pandas.
We plot realtime data for the first time. There is issue, such as focus stealing. We can deal with this with low level matplotlib.
7: Realtime Plotting Using Simple Data
Before we go into complex plotting, we have to walk the walk, and plot the plot, run the script.
Python Source Code
I recommend you to get an overview with reading the source. So you won’t get lost along the way.
Required Package
Interpolate from SciPy
Smoothing our realtime data is easy with SciPy.
import paho.mqtt.client as mqtt
import matplotlib
import matplotlib.pyplot as plt
import numpy as np
import time

from scipy import interpolate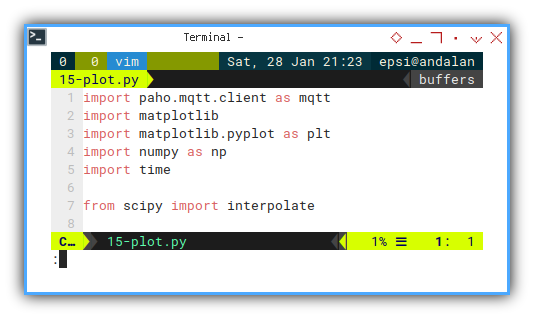
Skeleton
Looks like there’s no complex stuff. But in details, some method are longer than usual.
class mqSubscriber:
  def __init__(self):
  def chart_setup(self):
  def update_line(self, new_num):
  def on_connect(self, client, userdata, flags, rc):
  def on_message(self, client, userdata, msg):
  def main(self):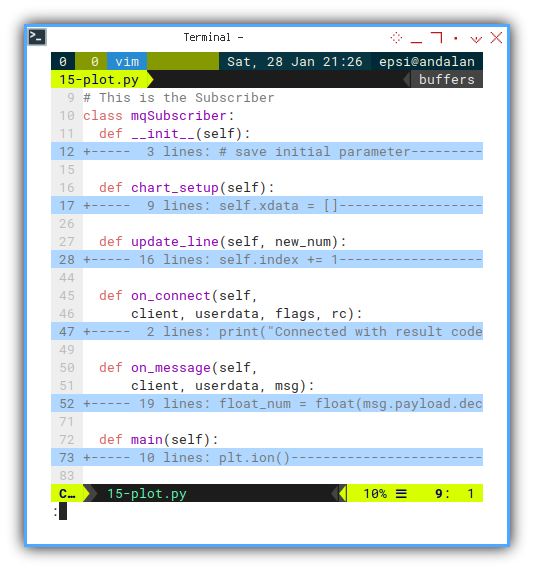
Constructor
We need to separate chart setup and initial data.
class mqSubscriber:
  def __init__(self):
    # save initial parameter
    self.index = 0
    self.chart_setup()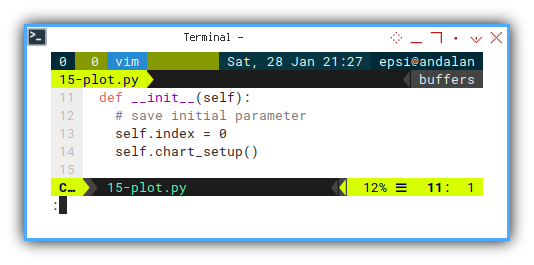
Setting Up Chart
Do not forget to setup the chart.
  def chart_setup(self):
    self.xdata = []
    self.ydata = []

    self.fig, self.axes = plt.subplots()
    self.line, = self.axes.plot(
      self.xdata, self.ydata, 'r-')

    self.fig.canvas.mpl_connect(
      'close_event', exit)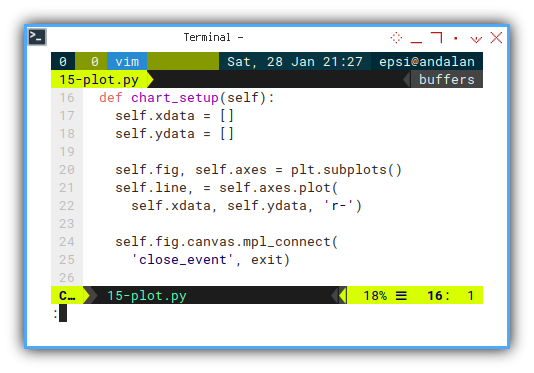
We will use self.axes and self.lines in our class method.
Main Method
Just very ordinary MQTT.
  def main(self):
    plt.ion()
    plt.show()

    client = mqtt.Client()
    client.connect("localhost",1883,60)

    client.on_connect = self.on_connect
    client.on_message = self.on_message

    client.loop_forever()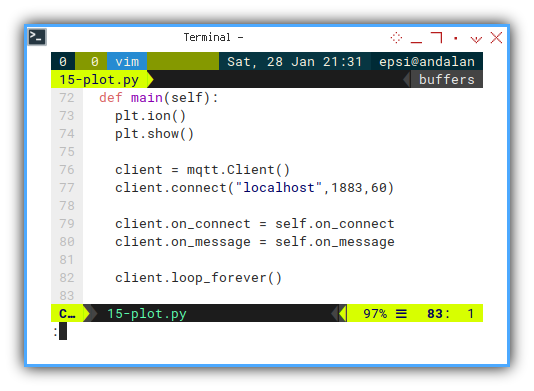
Except that we have this two lines:
    plt.ion()
    plt.show()
We should set the interactive mode on in realtime plot,
by calling plt.ion().
Event Handler: On Connect
Nothing special. The same as official documentation.
  def on_connect(self,
      client, userdata, flags, rc):
    print("Connected with result code "+str(rc))
    client.subscribe("topic/signal")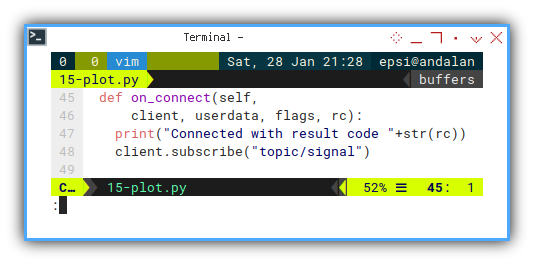
Event Handler: On Message
We need to update the line. I put the detail on its own method.
  def on_message(self, client, userdata, msg):
    float_num = float(msg.payload.decode())

    self.update_line(float_num)
Since the data change over time passes, we need to update the limit
    # recompute the ax.dataLim
    # update ax.viewLim using the new dataLim
    self.axes.relim()
    self.axes.autoscale_view()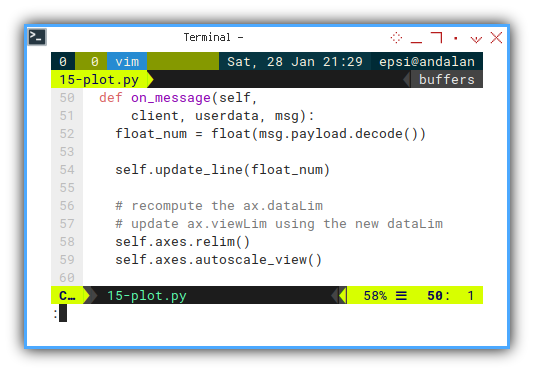
This is why I set self.axes on the chart setup.
Displaying Chart
Plotting Issue
All good, the data displayed correctly.
Except that when I call plt.show().
The window steal focus.
I can’t evenm type on my terminal,
because the focus always go back to matplotlib chart.
Nothing so bad. I google, then I find the answer on stackoverflow.
  def on_message(self, client, userdata, msg):
    ...

    # issue: steal focus
    plt.draw()

    self.fig.canvas.draw_idle()
    self.fig.canvas.start_event_loop(0.001)

    time.sleep(0.1)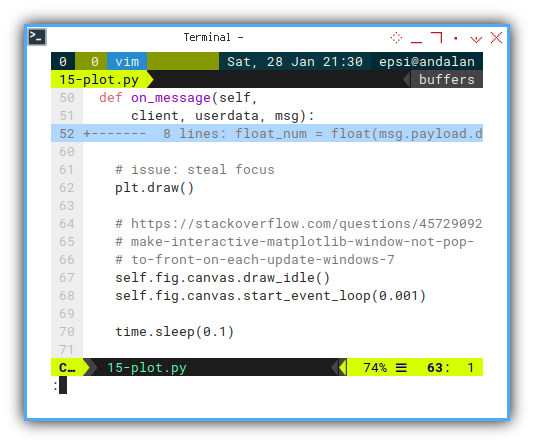
This is why I set self.fig on the first place.
I must admit, that I do no really understand about, what’s really going on here. But this works for me. Maybe I will go deep into low level matplotlib some other time.
Interpolation
Interpolation can be done this way:
      n = len(self.ydata)
      tck = interpolate.splrep(
        self.xdata, self.ydata, s=0)
      xfit = np.arange(0, n-1, np.pi/50)
      yfit = interpolate.splev(xfit, tck, der=0)
But we should aware that we can’t interpolate data, if the number of data is insufficient.
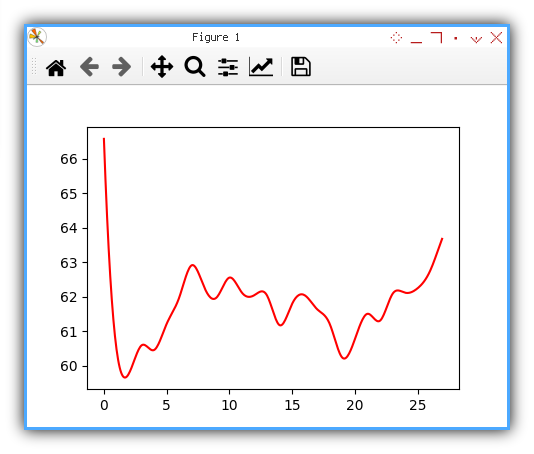
The result of interpolation can be displayed in below figure.
Updating Line
MQTT Message Handler
The complete method is here below.
Afterr get the right xfit and yfit series,
we can update the data series into matplotlib axes.
  def update_line(self, new_num):
    self.index += 1
    self.xdata.append(self.index)
    self.ydata.append(new_num)

    if self.index <= 3:
      self.line.set_xdata(self.xdata)
      self.line.set_ydata(self.ydata)
    else:
      n = len(self.ydata)
      tck = interpolate.splrep(
        self.xdata, self.ydata, s=0)
      xfit = np.arange(0, n-1, np.pi/50)
      yfit = interpolate.splev(xfit, tck, der=0)

      self.line.set_xdata(xfit)
      self.line.set_ydata(yfit)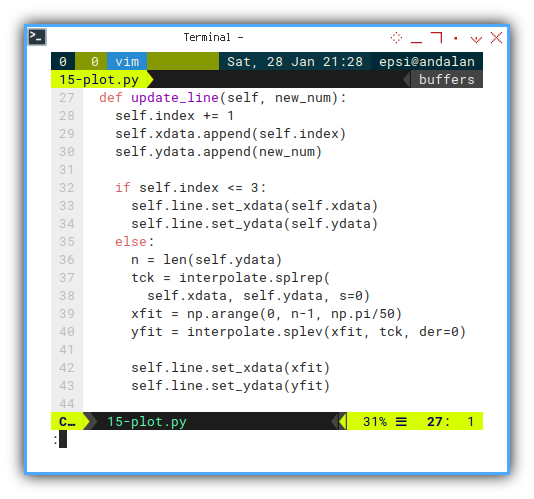
This is why I set self.line from the very beginning.
Execute: Run
We can humbly run the class in peace.
mqSub = mqSubscriber()
mqSub.main()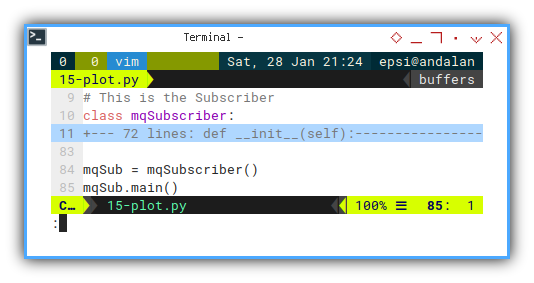
Chart Preview
It is a good time to run the code above.
This chart video below, should help you figure out, the result of code above.
As you can see the start point is stuck there, we will need to enhance the plot, so it looks like moving chart.
What is Next 🤔?
Simple realtime plotting achieved,but the real challenge is smoothing time series using dataframe. We have already solve smoothing time series in previous article, we still need to combine the trick with above plot, and also we need to make pretty chart.
This is the minimum viable prototype that we want to achieve.
Consider continue reading [ Python - MQTT - Smooth Timeseries Plot ].