Preface
Goal: Realtime data plot using Pandas.
This extra miles does not have anything to do with MQTT itself.
Disagreeable Code
The fact that the previous code works, does not means my previous code is not sucks. The code above also do not have any clarity about, how the limit view boundary works.
The class above also doing many things at once, collecting data in dataframe, and also drawing the plot chart. This makes the code less readable. Unreadable code above is unpleasant!
My code should be made to be ready to be read by other developer. My understanding reflect in my code. Shame on me if it looks ridiculously amateur.
Better Code
Consider clean up. Make things simple. Refactor to internal design, while preserving your working code. Read again, to avoid mistake sooner. No code enhancement, no new feature. Remain intact from external view.
Good separate of concern, can be achieved by making modular class. Extracting main class into two more supporting classes. This will save you time, whenever you read your own code.
Better code does not means not sucks either. But at least I can do something about it.
Issue
Face it like a man
We need to take care carefully, what property relies on specific class. And what property should be available in both supporting classes. Fail to do so, would only make your class more complex.
Experiment
I don’t know if what I do is right, or just another blunder. But here it is, what I did.
I have limited knowledge in UML and class refactoring. Please inform me if there’s something I can improve. Or even if I’m wrong.
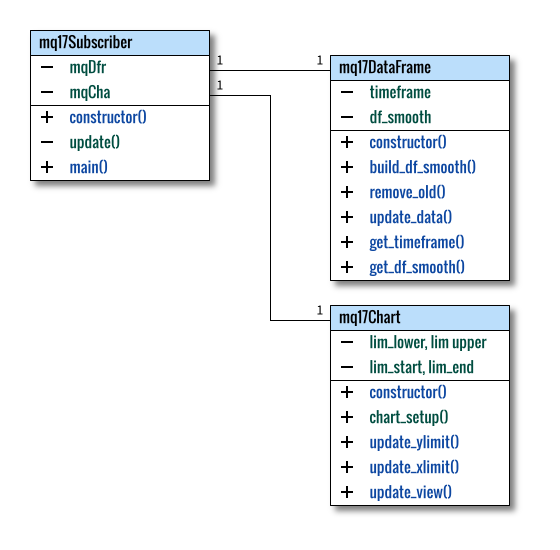
A: Overview
Python Source Code
May the open source, be with you.
The source will splitted into multi classes
Main Program
The main program would be as simple as below:
import asyncio
from mq17Subscriber import mqSubscriber

mqSub = mqSubscriber()

try:
  asyncio.run(mqSub.main())
except KeyboardInterrupt:
  print("\nGoodbye!")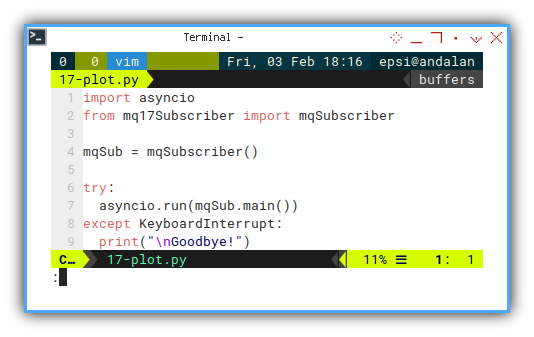
Running Script
You can runt the code by this command
❯ python 17-plot.py
25 : 21:30:08 - 21:30:24
Skeleton: mqSubscriber
You can imagine how simple the main class should be.
And each class skeleton is as below:
class mqSubscriber:
  MAX_DURATION = 40

  def __init__(self):
  def update(self, new_num):
  async def main(self):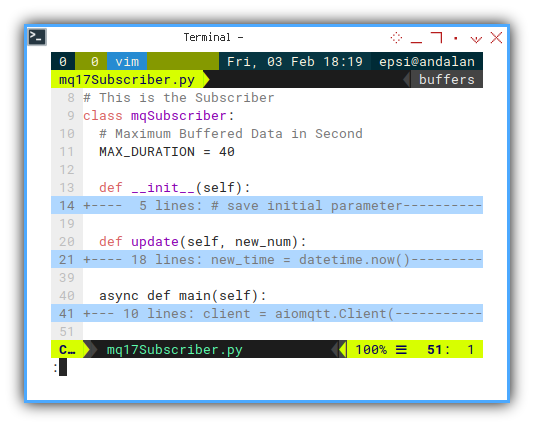
My purpose is to get the program flow right. Not so quick and dirty as previous article.
Skeleton: mqDataFrame
This is almost exactly the same. Except the last two properties getter.
class mqDataFrame:
  def __init__(self, max_duration):
  def build_df_smooth(self):
  def remove_old(self, index, new_time):
  def update_data(self, index, new_num, new_time):
  def get_timeframe(self):
  def get_df_smooth(self):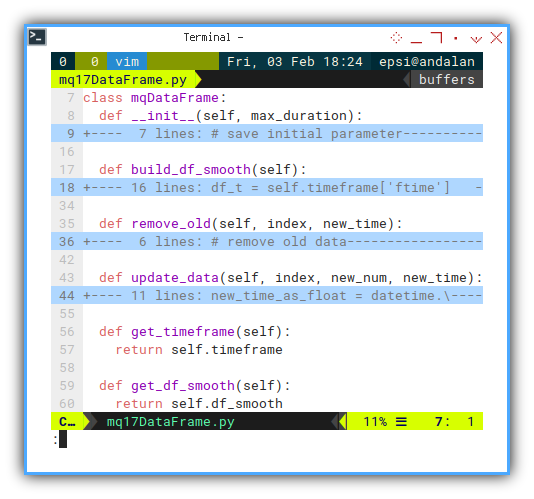
Skeleton: mqChart
class mqChart:
  def __init__(self, max_duration):
  def chart_setup(self):
  def update_ylimit(self, new_num):
  def update_xlimit(self, index, new_time):
  def update_view(self, index, timeframe, df_smooth):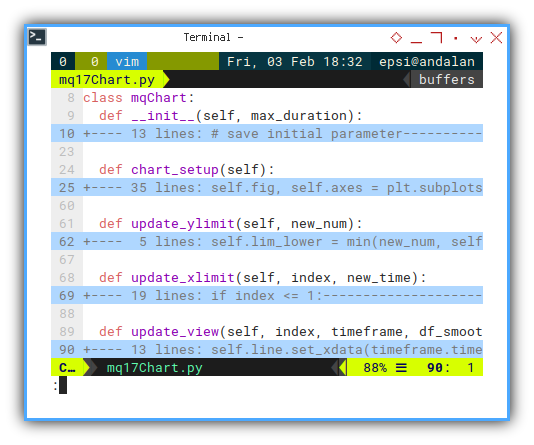
You can see how the methods are quite different, with previous one. I splitted the limit updating method into each axis.
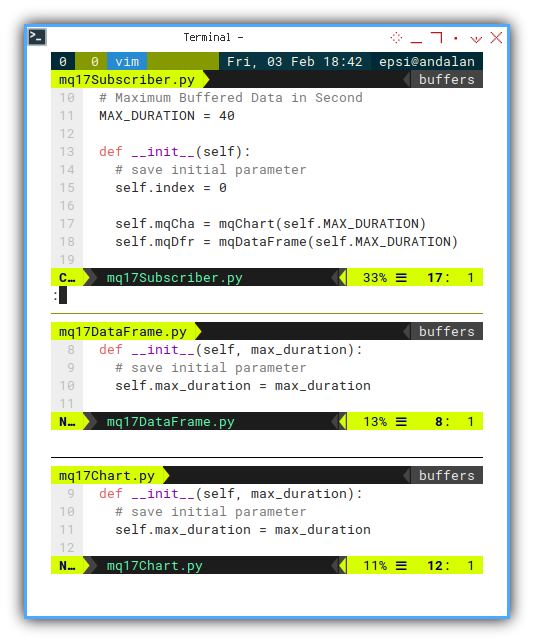
B: Subscriber Class
The main Class
Required Package
This require both supporting class:
import asyncio
import asyncio_mqtt as aiomqtt

from datetime      import datetime
from mq17Chart     import mqChart
from mq17DataFrame import mqDataFrame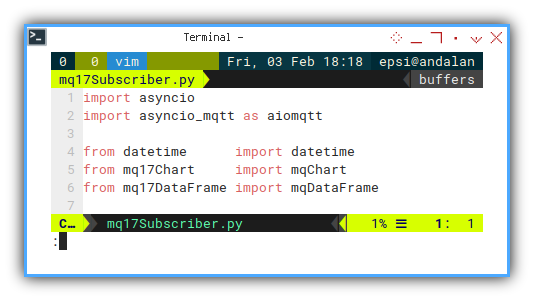
Package Constructor
The index properties is lingering anywhere.
class mqSubscriber:
  # Maximum Buffered Data in Second
  MAX_DURATION = 40

  def __init__(self):
    # save initial parameter
    self.index = 0

    self.mqCha = mqChart(self.MAX_DURATION)
    self.mqDfr = mqDataFrame(self.MAX_DURATION)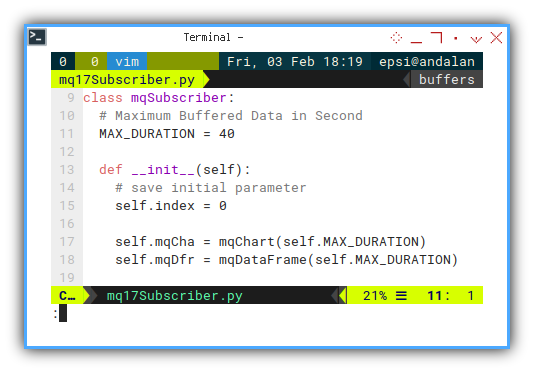
Then create both instance of supporting classes.
Main Method
This is very common. Very similar from official document of MQTT.
  async def main(self):
    client = aiomqtt.Client(
      hostname="localhost", port=1883)

    async with client:
      async with client.messages() as messages:
        await client.subscribe("topic/signal")

        async for message in messages:
          new_num = float(message.payload)
          self.update(new_num)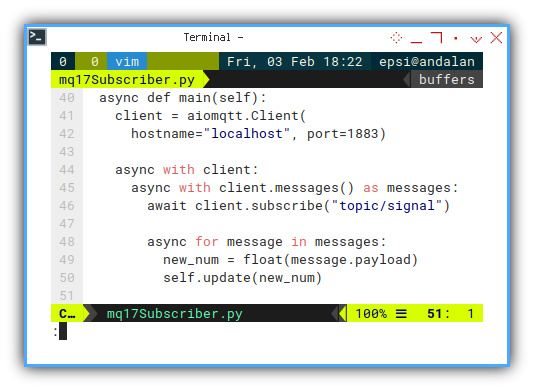
The only thing it does is calling update method.
Message Handler: Update
Flow
The main program flow can be tidied as below code.
First, the handle the data:
  def update(self, new_num):
    new_time = datetime.now()
    self.mqDfr.update_data(
        self.index, new_num, new_time)
    self.index += 1

    if self.index > 3:
      self.mqDfr.build_df_smooth()
      self.mqDfr.remove_old(self.index, new_time)
And then handle the chart:
    self.mqCha.update_ylimit(new_num)

    self.mqCha.update_xlimit(
      self.index, new_time)

    self.mqCha.update_view(
      self.index,
      self.mqDfr.get_timeframe(),
      self.mqDfr.get_df_smooth())
We relies heavily on index properties.
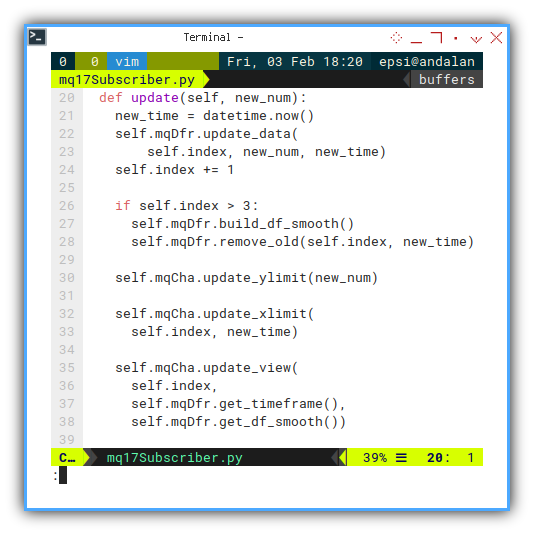
The steps can be summarized as:
- Update DataFrame
- Interpolation: Build smooth Data
- Purge old buffer.
- Update Limit, both horizontal and vertical.
- Update Realitme Chart
C: Data Class
All the dataframe related should be placed here.
Required Package
Pandas, and SciPy
import pandas as pd
import numpy  as np

from datetime import datetime, timedelta
from scipy    import interpolate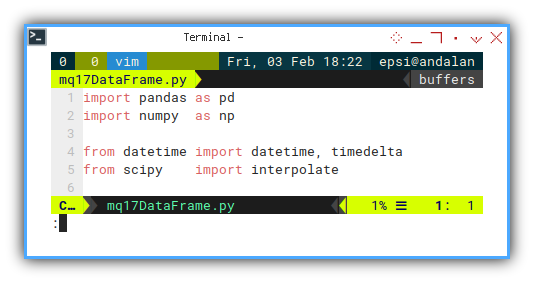
Constructor
Prepare both empty dataframe.
class mqDataFrame:
  def __init__(self, max_duration):
    # save initial parameter
    self.max_duration = max_duration

    self.timeframe = pd.DataFrame({
      "time": [], "ftime": [], "temp": [] })
    self.df_smooth = pd.DataFrame({
      "time": [], "temp": [] })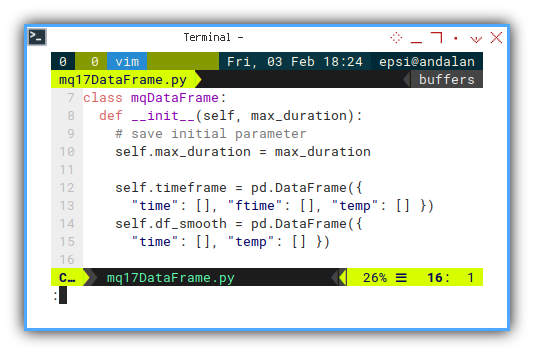
Properties Getter
Both Getter.
  def get_timeframe(self):
    return self.timeframe

  def get_df_smooth(self):
    return self.df_smooth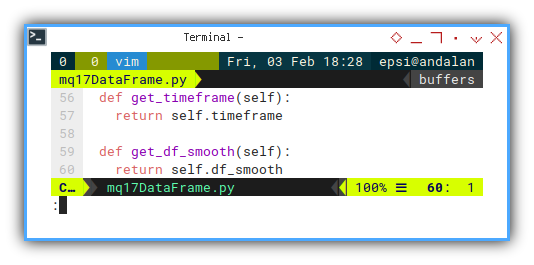
You can call the property directly without this getter.
Timeframe Data Update
No changes intact
  def update_data(self, index, new_num, new_time):
    new_time_as_float = datetime.\
      timestamp(new_time)

    new_pair = pd.DataFrame({
      "time" : new_time,
      "ftime": new_time_as_float,
      "temp" : new_num
    }, index=[index])

    self.timeframe = pd.concat(
      [self.timeframe, new_pair])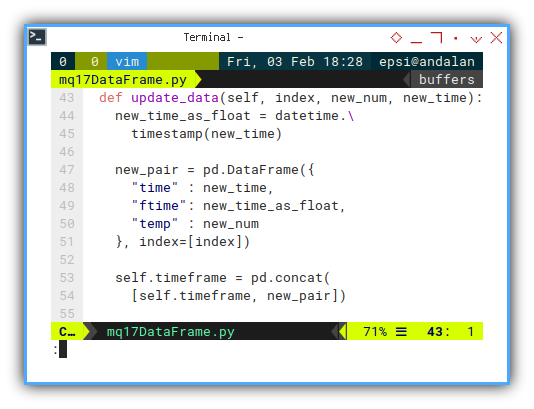
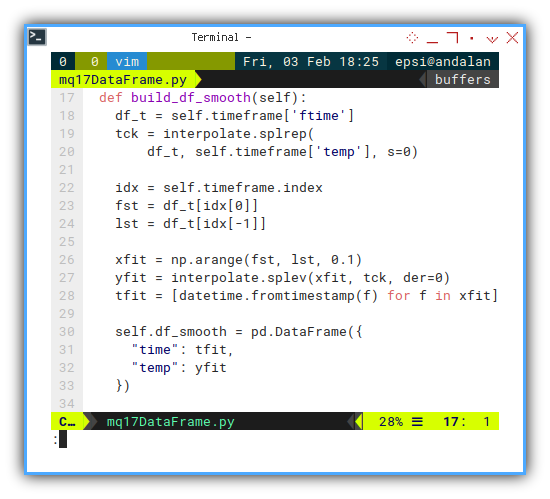
Interpolation
No changes intact.
  def build_df_smooth(self):
    df_t = self.timeframe['ftime']
    tck = interpolate.splrep(
        df_t, self.timeframe['temp'], s=0)

    idx = self.timeframe.index
    fst = df_t[idx[0]]
    lst = df_t[idx[-1]]

    xfit = np.arange(fst, lst, 0.1)
    yfit = interpolate.splev(xfit, tck, der=0)
    tfit = [datetime.fromtimestamp(f) for f in xfit]

    self.df_smooth = pd.DataFrame({
      "time": tfit,
      "temp": yfit
    })
Purge Old Signal
remove data outside boundary
I simplify the code.
Move the limit start, into chart class,
instead of putting the line here.
  def remove_old(self, index, new_time):
    obsolete = new_time \
      - timedelta(seconds=self.max_duration)

    self.timeframe = self.timeframe\
      [self.timeframe.time >= obsolete]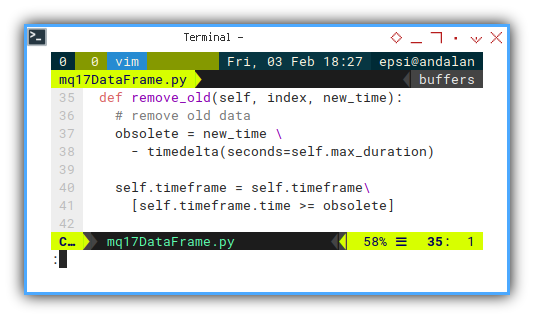
We should not put any chart calculation here.
D: Chart Class
All the chart related should be placed here.
I have to simplify boudary calculation.
Required Package
Again, Matplotlib!
import matplotlib
import matplotlib.pyplot as plt
import matplotlib.dates as md

from datetime import timedelta
from time     import sleep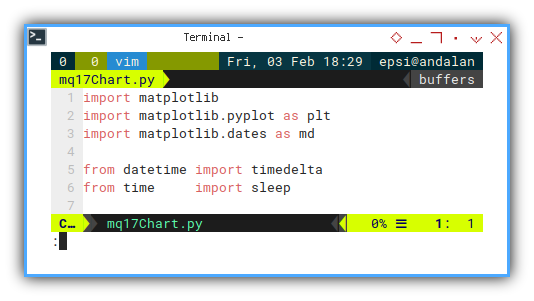
Constructor
I move the chart nitialization here, including interactive mode.
class mqChart:
  def __init__(self, max_duration):
    # save initial parameter
    self.max_duration = max_duration

    self.lim_lower = 10
    self.lim_upper = 40

    self.lim_start = None
    self.lim_end   = None

    self.chart_setup()

    plt.ion()
    plt.show()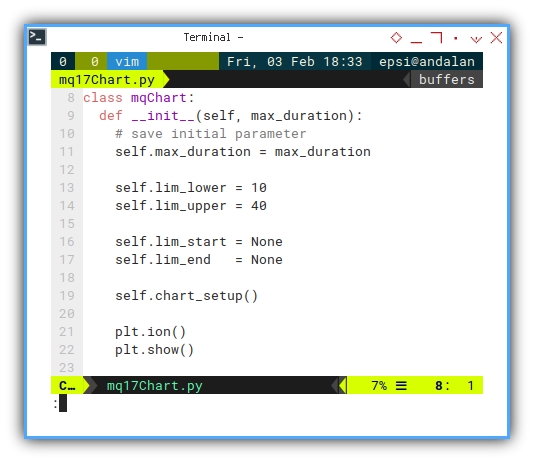
Vertical Boundary
This is simple, let’s separate it here.
  def update_ylimit(self, new_num):
    self.lim_lower = min(new_num, self.lim_lower)
    self.lim_upper = max(new_num, self.lim_upper)

    self.axes.set_ylim(
      self.lim_lower - 15, self.lim_upper + 10)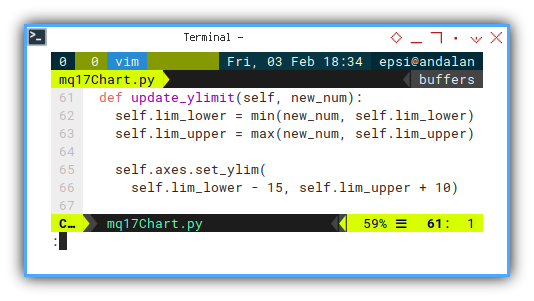
Horizontal Boundary
This is not complex, but rather something new. I put all the limit stuff here. Including the moving chart calculation, by changing left limit in x axis..
  def update_xlimit(self, index, new_time):
    if index <= 1:
      self.lim_start = new_time
    else:
      self.lim_end = new_time

      obsolete = new_time \
        - timedelta(seconds=self.max_duration )

      if index > self.max_duration:
        self.lim_start = obsolete

      self.axes.set_xlim(
        self.lim_start - timedelta(seconds=1),
        self.lim_end   + timedelta(seconds=1))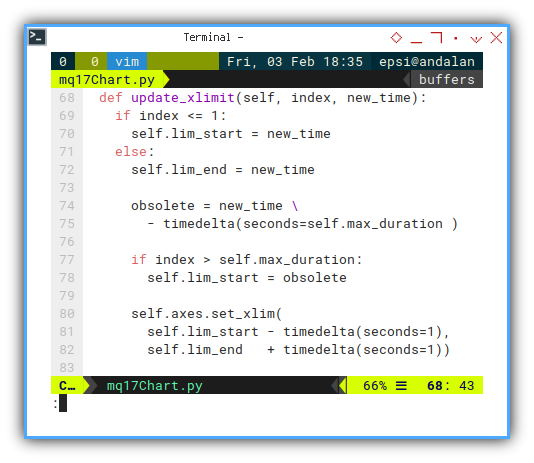
Boundary Status
If you wish for debugging purpose.
      st = self.lim_start.strftime("%H:%M:%S")
      nd = self.lim_end.  strftime("%H:%M:%S")
      print("%d : %s - %s" % (index, st, nd),
        end="\r", flush=True)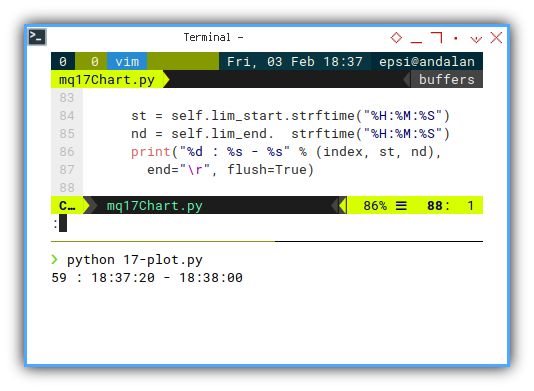
Chart Setup
Verbatim Copy
No code changes intact.
This original code is long, I only put the first four lines.
  def chart_setup(self):
    self.fig, self.axes = plt.subplots()
    self.axes.set_ylim(
      self.lim_lower, self.lim_upper)

    ...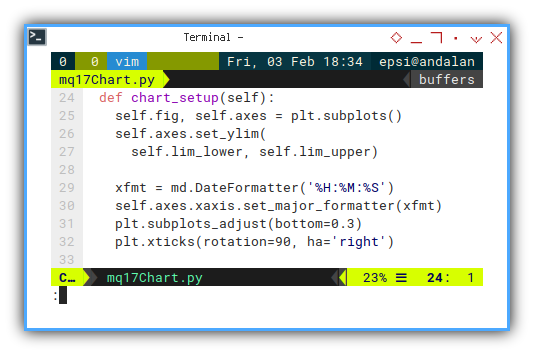
You can check the complete code in github source above.
Draw Chart
This has a slight change.
  def update_view(self, index, timeframe, df_smooth):
    self.line.set_xdata(timeframe.time)
    self.line.set_ydata(timeframe.temp)

    if index > 3:
      self.smooth.set_xdata(df_smooth.time)
      self.smooth.set_ydata(df_smooth.temp)

    # tips: not to steal focus
    plt.draw()
    self.fig.canvas.draw_idle()
    self.fig.canvas.start_event_loop(0.001)

    sleep(0.1)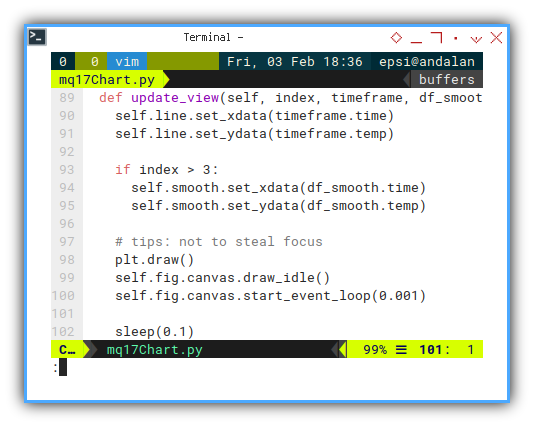
Pretty different with previous code right?
Conclusion
This should be enough for minimum viable prototype.
You should be ready to integrate this code, combining with your own project, publish to your local friend, and gather your own team to make prototype in your local area.
What do you think?
Farewell. We shall meet again.