Preface
Goal: Extending unified configuration. Closing the final steps by refactoring to separate files.
Welcome to the grand finale. Where we take our formatting adventure to the next level. We’re not just coloring inside the lines anymore. We’re building new lines altogether! This time, we’ll extend the class structure to handle advanced tasks like group-based data coloring. And, because life is too short to rewrite the same script over and over, we’ll break the logic into separate files for maximum reuse across projects.
Think of it as upgrading from a Swiss Army knife to a full-blown workshop.
Example Sheet
Our dataset?
This time, we’re shaking things up. No more 40-sheet workbook marathons. We’re keeping it simple with one worksheet, that’s still packed with enough data to make a spreadsheet lover’s heart skip a beat.
Our dataset is movie examples from 1900 to 2019, with every title containing the keyword movie.
You can download the example XLSX input source here:
And the example XLSX result here:
This workbook contains only a single worksheet, but it’s a blockbuster in its own right.
08: Step Eight
In this step, we extend the script’s capabilities by incorporating a new method, without changing the existing configuration.
I want to enhance the script, so it can color rows based on the year of the movie release. This will be achieved with the proper class structure, especially the basic flow.
Step Overview
This section covers the following topics:
- Helper: Row coloring
- Formatting Procedure: Groups coloring
- Formatting Procedure: Format data font
Script Source
You can obtain the script source for this step from the repository:
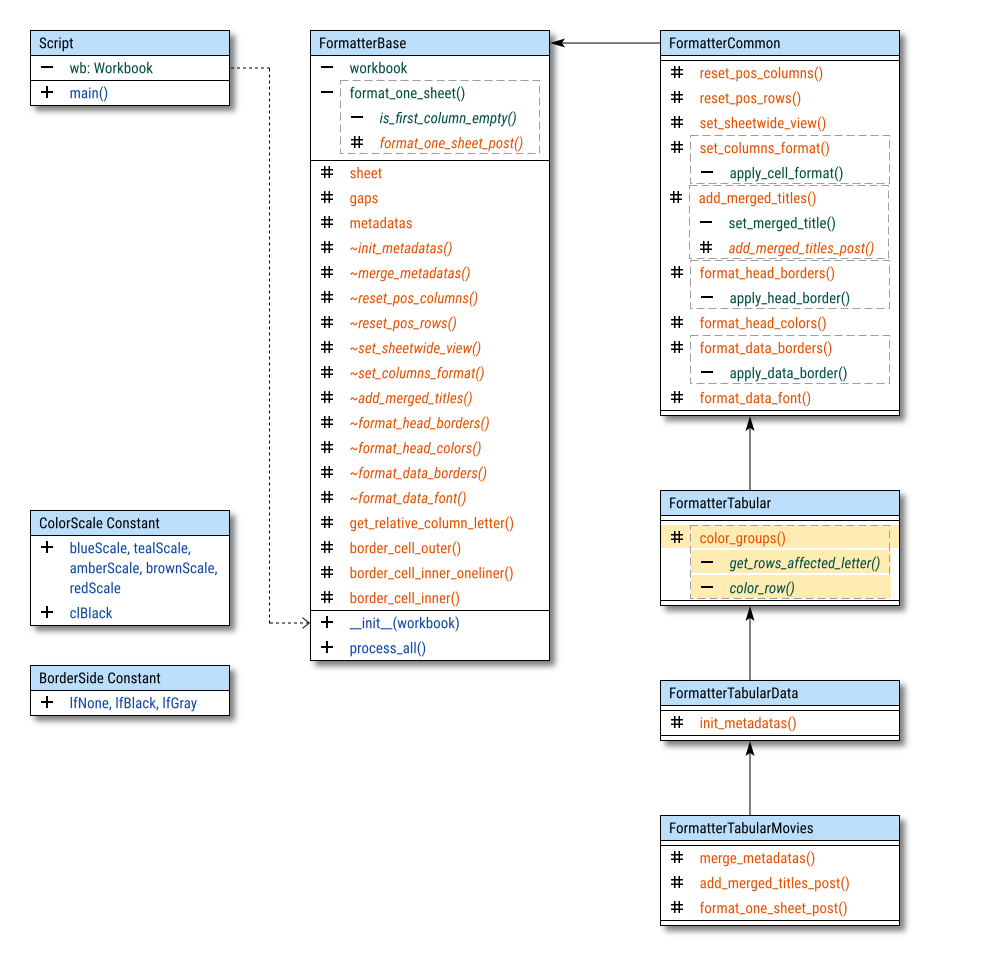
Class Diagram
Hooks, and nomore abstract!
Rather than overriding methods, we’ll use hooks in this step. There are two key examples of this approach:
_add_merged_titles_post()_format_one_sheet_post()
This allows us to easily implement
the formatting procedure _color_groups()
in the FormatterTabular class,
along with supporting methods: __color_row() and __get_cols_affected().
Note on the Class Implementation
Where to put tabular method?
The _color_groups() method is
implemented in the FormatterTabular class,
rather than in the FormatterCommon or FormatterTabularMovies classes.
This decision was made because, in real-world spreadsheet tasks,
I frequently encounter tabular data that requires color highlighting.
In contrast, other types of data (such as summaries, pivot tables, etc.) don’t require this kind of formatting. Each of those would need very different implementations, so the coloring feature is specifically tied to the FormatterTabular class.
Similarly, I’ve chosen not to duplicate the coloring methods in every descendant of the tabular class. Since this feature is well-suited for the FormatterTabular class, it’s more efficient to keep it there rather than repeating it across multiple descendants.
Basic Flow
Formatter Base Class
Instead of barging into the base class like an uninvited guest, we politely knock on the door using hooks to extend the functionality. Clean, respectful, and no broken furniture!
For instance, we use the hook _add_merged_titles_post(),
to alter value manually, like this example below:
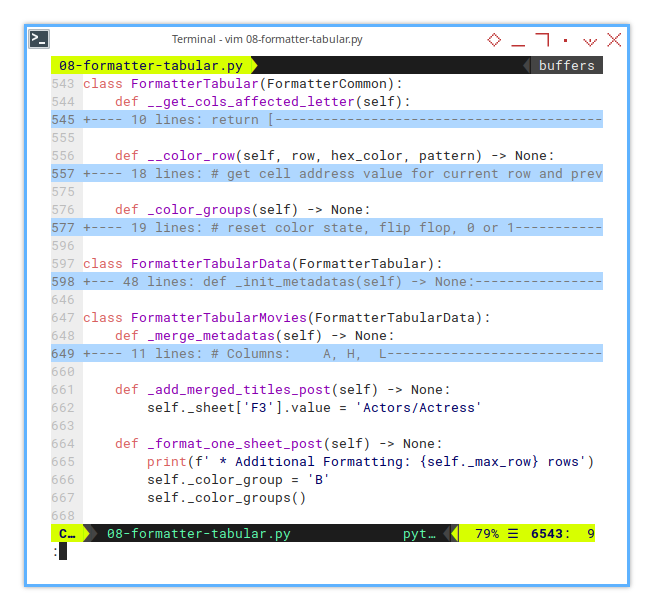
    def _add_merged_titles_post(self) -> None:
        self._sheet['F3'].value = 'Actors/Actress'
And here’s how we use the _format_one_sheet_post() hook:
    def _format_one_sheet_post(self) -> None:
        print(f' * Additional Formatting: {self._max_row} rows')
        self._color_group = 'B'
        self._color_groups()
Let’s look at how the hook is handled
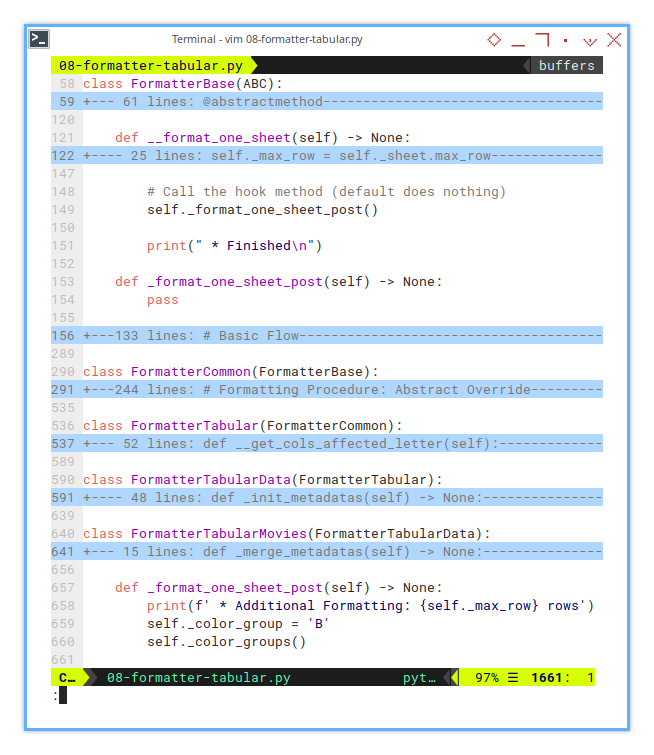
in the FormatterBase class:
def __format_one_sheet(self) -> None:
...
# Call the hook method (default does nothing)
self._format_one_sheet_post()
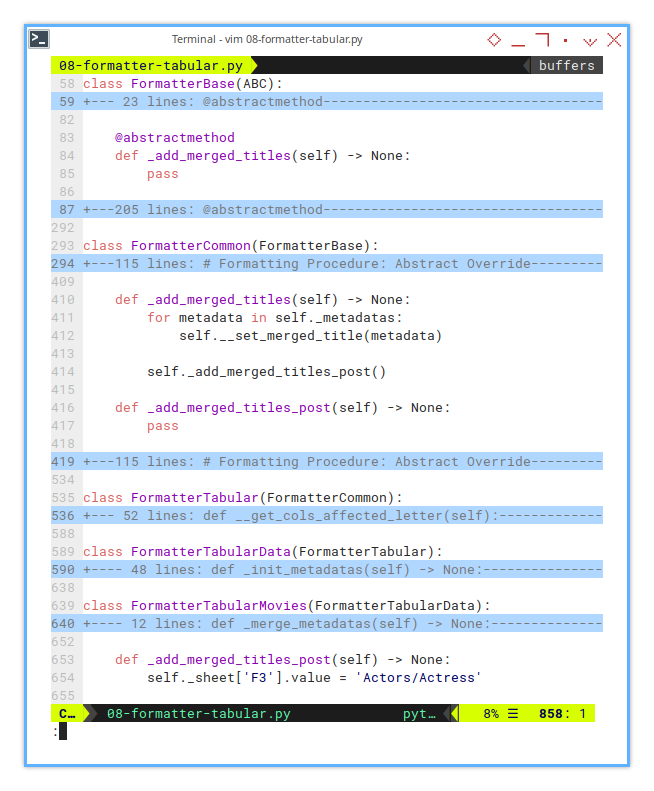
print(" * Finished\n")And also in the FormatterCommon class.
    def _add_merged_titles(self) -> None:
        for metadata in self._metadatas:
            self.__set_merged_title(metadata)

        self._add_merged_titles_post()
Now, let’s get back to the main topic:
this is where the _color_groups() method comes into play.
Formatting: Group Coloring
Now, let’s dive into the _color_groups() method.
This method works by flipping between,
two color states—0 and 1—and applying a different color for each state.
In simpler terms, it’s about deciding whether to color the rows or not.
To make the process more transparent, I’ve added progress notifications in the console. For every 2500 rows, the script gives you a friendly wave. Because staring at an unresponsive terminal is like waiting for a pot to boil.
I also introduced a new instance variable: self._cols_affected.
This little tracker, keeps a watchful eye on affected rows.
And I print the affected letters in the terminal console,
because nothing is worse than a formatting bug,
hiding like a ninja in your spreadsheet!
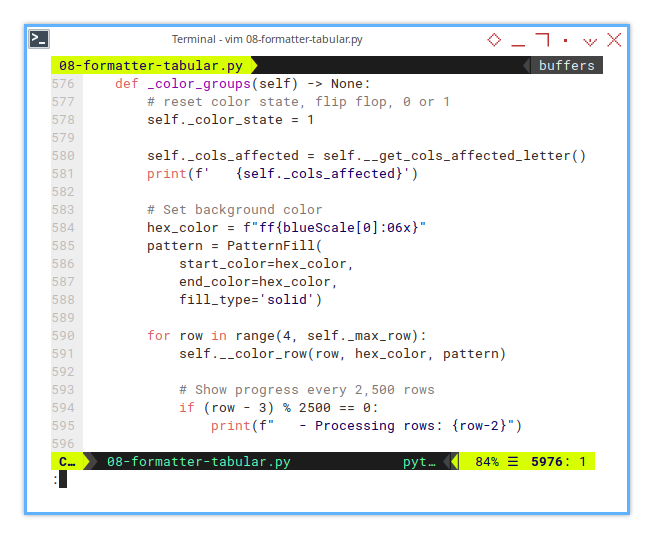
Here’s how the _color_groups() method looks.
First it initialize required variable outside the loop,
so we do not need to calculate over and over again in a loop.
    def _color_groups(self) -> None:
        # reset color state, flip flop, 0 or 1
        self._color_state = 1

        self._cols_affected = self.__get_cols_affected_letter()
        print(f'   {self._cols_affected}')

        # Set background color
        hex_color = f"ff{blueScale[0]:06x}"
        pattern = PatternFill(
            start_color=hex_color,
            end_color=hex_color,
            fill_type='solid')

        ...
Then we start the loop. The real workhorse is here.
    def _color_groups(self) -> None:
        ...

        for row in range(4, self._max_row):
            self.__color_row(row, hex_color, pattern)

            # Show progress every 2,500 rows
            if (row - 3) % 2500 == 0:
                print(f"   - Processing rows: {row-2}")
Now, let’s put the entire method together in one class,
from _color_groups() method,
including both supporting methods:
__color_row()__get_cols_affected_letter()
Supporting Helper: Row Coloring
Is it a new group, or just déjà vu?
In this helper method, we determine whether a row belongs to a different group, by comparing the current row’s release year with the previous row’s. If the values are different, it indicates a new group, and we flip the color state accordingly.
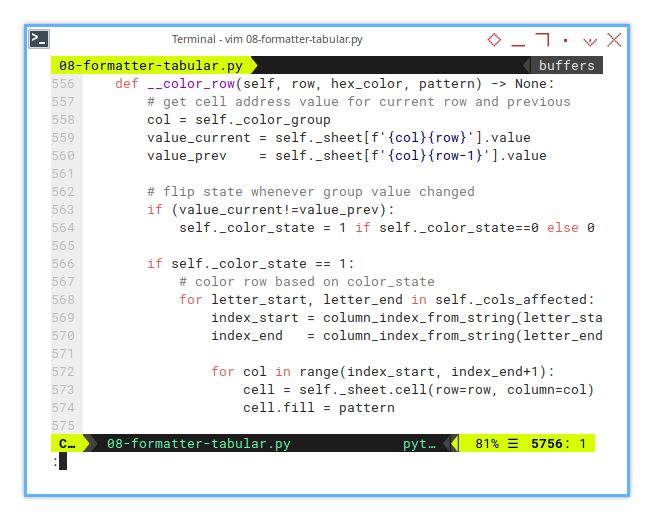
The __color_row() method logic works.
- Comparing current row value and previous value
- flipping the state whenever value changed.
    def __color_row(self, row, hex_color, pattern) -> None:
        col = self._color_group
        value_current = self._sheet[f'{col}{row}'].value
        value_prev    = self._sheet[f'{col}{row-1}'].value

        if (value_current!=value_prev):
            self._color_state = 1 if self._color_state==0 else 0

        if self._color_state == 1:
            ...
And here is the real formatting procedure. Only applied if the color state equal to one.
if self._color_state == 1:
    # color row based on color_state
    for letter_start, letter_end in self._cols_affected:
        index_start = column_index_from_string(letter_start)
        index_end   = column_index_from_string(letter_end)

        for col in range(index_start, index_end+1):
            cell = self._sheet.cell(row=row, column=col)
            cell.fill = pattern
Instead of locking this logic to hardcoded column letters
(a nightmare for future edits),
we rely on the dynamic self._cols_affected instance variable to define the cell range.
If our columns dance around, the script will keep up!
No more hardcoded column letters.
Dynamic range means we can modify metadata, without rewriting this method. Saving us from future headaches when spreadsheets evolve.
The value for self._cols_affected,
comes from the __get_cols_affected_letter() method.
Supporting Helper: Getting Affected Letter
Metadata: where the real magic happens.
This part handles the nitty-gritty of configuration metadata. Rebuilding an array of tuples representing the cell ranges we need to paint. Think of it as telling the script: “These are the spots that deserve a makeover.”
We achieve this by using a list comprehension. A powerful Pythonic trick that makes us look like wizards but works like a charm.
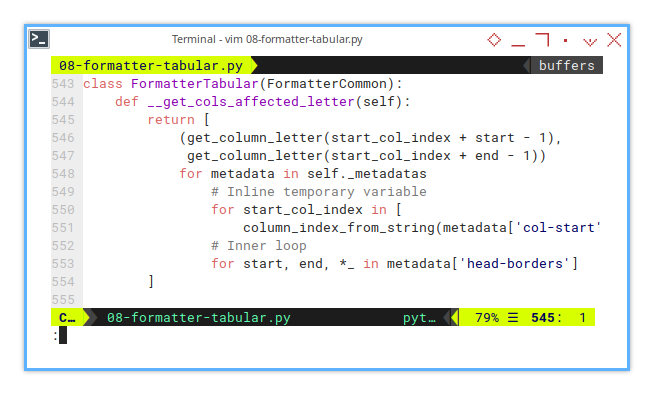
Here’s how the __get_cols_affected_letter() method works:
    def __get_cols_affected_letter(self):
        return [
            (get_column_letter(start_col_index + start - 1),
             get_column_letter(start_col_index + end - 1))
            for metadata in self._metadatas
                # Inline temporary variable
                for start_col_index in [
                    column_index_from_string(metadata['col-start'])]
                # Inner loop
                for start, end, *_ in metadata['head-borders']
        ]
Without this helper, we’d be stuck with static definitions, for affected columns—zero adaptability This dynamic method ensures that as our metadata evolves, the script effortlessly keeps pace.
In real tasks, spreadsheet configurations change, often without warning. With this helper, our script adapts instead of crumbling under pressure.
And hey, it’s not just clever. This method is a direct result of countless spreadsheet encounters, where list rebuilding became the only way to keep things sane. Trust me, it’s worth it.
Script Call
Represent the Class in Script
For this kind of formatting, we need a different kind of data. all we need is to change the input source and output target.
![openpyxl: Step One: Script Call][112-py-script-call]
def main() -> None:
    input_xlsx  = "../xlsx/movies_all.xlsx"
    output_xlsx = "../xlsx/movies_all_formatted.xlsx"

    wb = load_workbook(input_xlsx)
    formatter = FormatterTabularMovies(wb)
    formatter.process_all()
    wb.save(output_xlsx)
This snippet is the bridge between configuration and reality. Without calling the formatter, all that fancy logic just sits there gathering dust. This is how you unleash its power on real-world data.
Sheet Result
Like Sorting Socks by Color
The output sheet isn’t just a plain table anymore. It becomes a vibrant display where rows sharing the same release year form neat, color-coded groups. It’s like a personal assistant highlighting our favorite movie eras
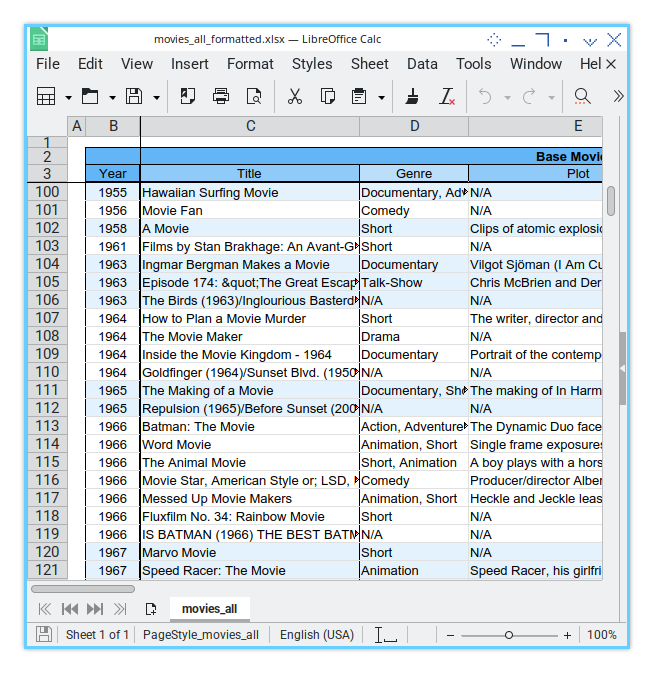
Grouping rows by color helps us spot patterns at a glance. Whether it’s a flood of ’90s action flicks, or a suspiciously large number of rom-coms from 2004. It’s data storytelling, but prettier.
Terminal Log
Our Formatter’s Diary
Under the hood, the terminal log spills all the secrets. It tracks each major formatting step, including our new row-coloring magic, and even shows which cell ranges are affected.
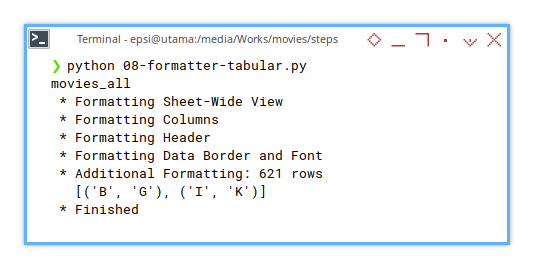
❯ python 08-formatter-tabular.py
movies_all
 * Formatting Sheet-Wide View
 * Formatting Columns
 * Formatting Header
 * Formatting Border
 * Additional Formatting: 621 rows
   [('B', 'G'), ('I', 'K')]
 * Finished
These logs are our best friend when things go sideways, that oftenly required trial and error. They provide a clear trail of what the script is doing, and where things might be getting stuck. Like breadcrumbs in a data forest.
Just remember, at the end, what we need is the result, not the log process.
09: Step Nine
The Final Form of the Macro
To ensure that our base class can be used, for a variety of spreadsheet configurations, we need to refactor it into a modular structure. This allows us to treat the class, as a reusable library that can be imported as needed.
Think of it as transforming a kitchen junk drawer, into neatly labeled containers. We’ll thank ourself later.
Step Overview
The objective is:
- Separating the base class into libraries for modularity and reuse.
Modular code is easier to maintain, extend, and debug. Plus, it spares future-us from the horror of monolithic scripts
Script Source
We’ll break the previous macro into multiple files for better organization:
In the movies folder
In the movies/lib folder
- github.com/…/movies/lib/ColorScale.py
- github.com/…/movies/lib/FormatterBase.py
- github.com/…/movies/lib/FormatterTabular.py
This results in a total of five Python scripts, in a well-organized file structure.
Package Diagram
The package structure can be illustrated in the following diagram.
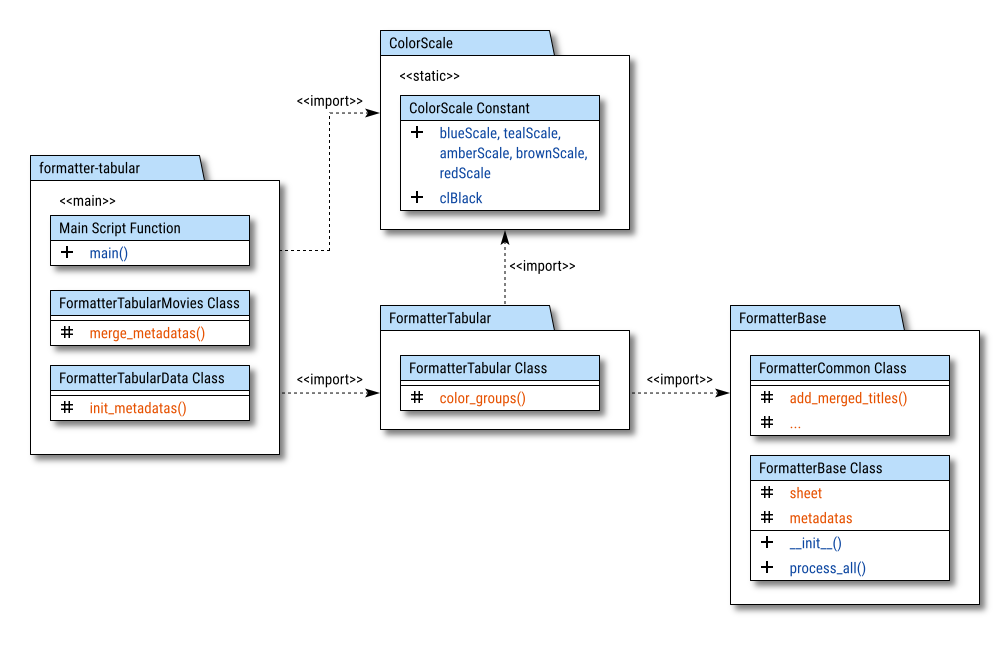
The relationships between the components are marked with <<import>>.
The <<main>> mark indicates the primary importance of the component,
while <<static>> is used to highlight constants.
Library Path
Adding the path to the script
No need to set any path. Python finds things as long as you keep your folders tidy.
Import Statements
Just add the folder name, such as lib.
Now that each part is reusable, and we can import only what we needed. We can see the variation in example in variation below:
In the main script:
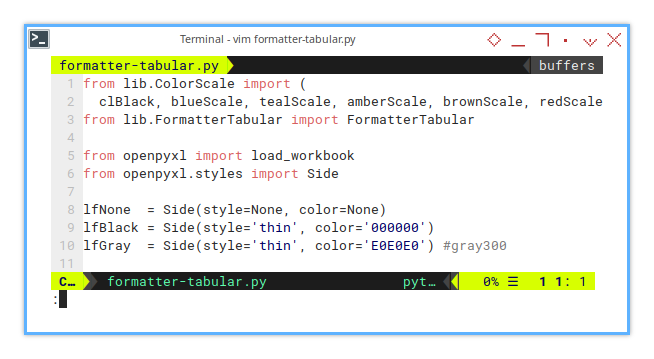
from lib.ColorScale import (
  clBlack, blueScale, tealScale, amberScale, brownScale, redScale)
from lib.FormatterTabular import FormatterTabular
In the descendant class (of the base class):
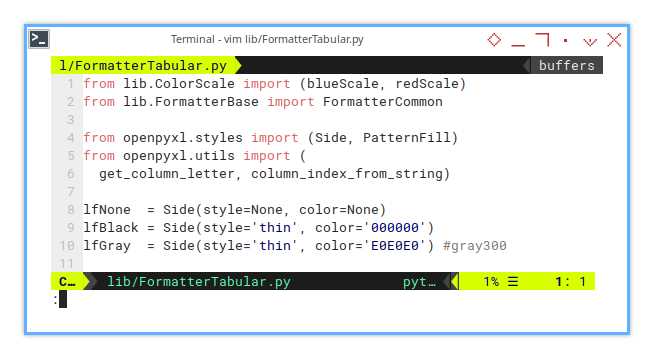
from lib.ColorScale import (blueScale, redScale)
from lib.FormatterBase import FormatterCommon
Now we’re done! The python script is ready to be deployed.
Terminal Log
The log result is exactly the same as previous.
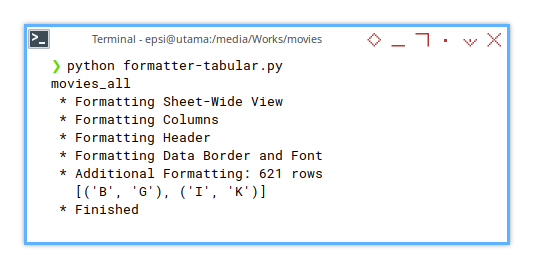
❯ python formatter-tabular.py
movies_all
 * Formatting Sheet-Wide View
 * Formatting Columns
 * Formatting Header
 * Formatting Border
 * Additional Formatting: 621 rows
   [('B', 'G'), ('I', 'K')]
 * Finished
Congratulations on completing the unified configuration!
You now hold the power of modular formatting. Use it wisely (or at least, have fun with it).
Conclusion
At this point, we can compare the libreoffice macro project, with the openpyxl script version.
Write code like you’re the next person to maintain it. Then rewrite it like you actually care.
Now, that it is finished. I’m going to have a rest. Sleep like I’m billing the universe for it.
What is Next 🤔?
Automation using Google Sheets. Yeah, that’s right, the GAS (Google Apps Script). This is definitely going to be another trial and error.
If OpenPyXL is like taming a mischievous puppy, GAS is a full-blown rodeo. JavaScript quirks, asynchronous oddities. It’s a whole new flavor of chaos. But hey, what’s life without a little adventure?
So buckle up, because the next journey is going to be wilder, messier, and possibly powered by sheer stubbornness.
Thank you for visiting. We shall meet again. Farewell (for now).