Preface
Goal: Further sheet wide formatting using using simple configuration.
After building the basic script, it’s time to level up. This round, we dive deeper into configuration magic, making our formatting fancier, smarter, and way easier to maintain.
No more hunting through lines of code just to tweak a column position. Instead, we’ll put the power into a clean, centralized configuration. Because, hardcoding is so last decade.
Along the way, expect abstract methods, a bit of design pattern goodness, and plenty of log messages to keep things honest.
Buckle up, it’s going to be a smooth, configurable ride.
02: Step Two
Now that the columns are set, let’s move on to the rows.
Step Overview
Here’s what topic we’ll cover:
- Helper: Last Row
- Helper: Prevent Re-inserting Column
- Formatting Procedure: Insert row gap, set row height
Script Source
The source for this step is available in the repository:
Class Diagram
What’s new this time?
We’re introducing _reset_pos_rows(),
including both its abstract definition and implementation.
In the diagram, this abstract method is marked with a # symbol.
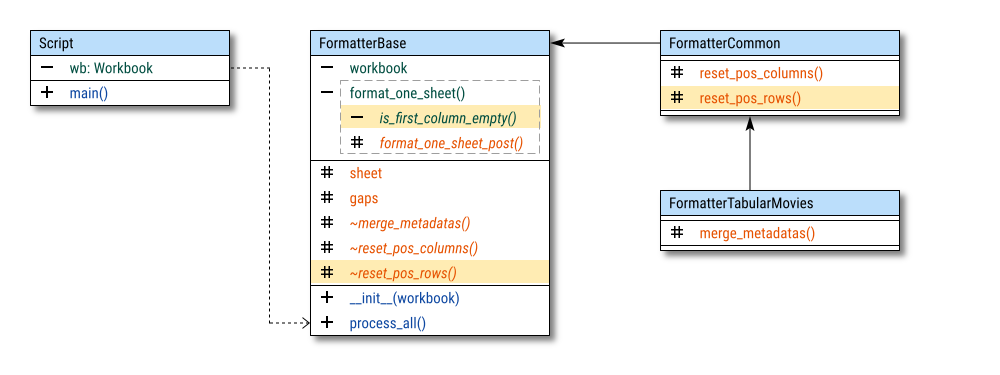
As always, I’ve highlighted the new additions, whether constants, properties, or methods, so you can easily track the updates.
Abstract Method
This step only adds one new abstract method: _reset_pos_rows().
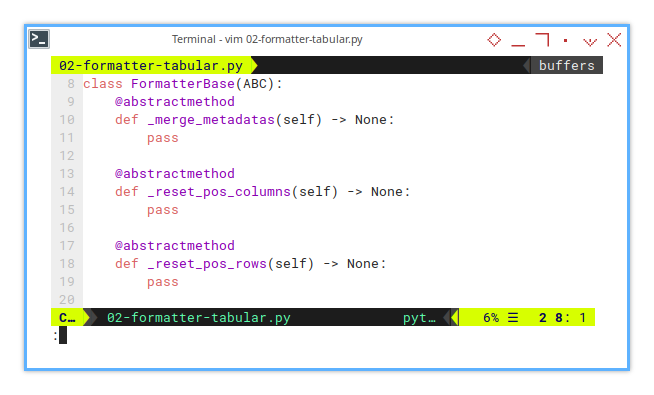
class FormatterBase(ABC):
    @abstractmethod
    def _merge_metadatas(self) -> None:
        pass

    @abstractmethod
    def _reset_pos_columns(self) -> None:
        pass

    @abstractmethod
    def _reset_pos_rows(self) -> None:
        pass
With this in place, we can smoothly integrate row formatting into the existing flow.
Initialization
New player in town:
_max_row
There’s a slight change in initialization process,
with additional _max_row variable.
This keeps track of the last populated row.
A handy little counter to avoid overshooting into Excel’s abyss.
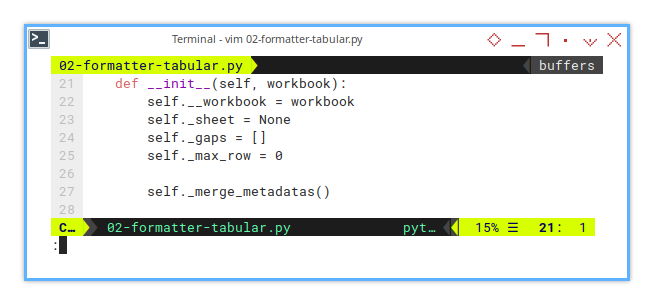
    def __init__(self, workbook):
        self.__workbook = workbook
        self._sheet = None
        self._gaps = []
        self._max_row = 0

        self._merge_metadatas()
We just need to know where it end.
Without _max_row, we would be blindly inserting rows,
without knowing where the data actually ends.
This way, our row gaps stay neatly aligned,
with the real content.
No phantom rows in sight.
Basic Flow
Formatter Base Class
This approach mirrors the previous column arrangement process, with a twist. Now, we’re adding a new hook for handling row gaps.
Instead of just rearranging columns, Now we can inject gaps between rows and apply precise formatting to them.
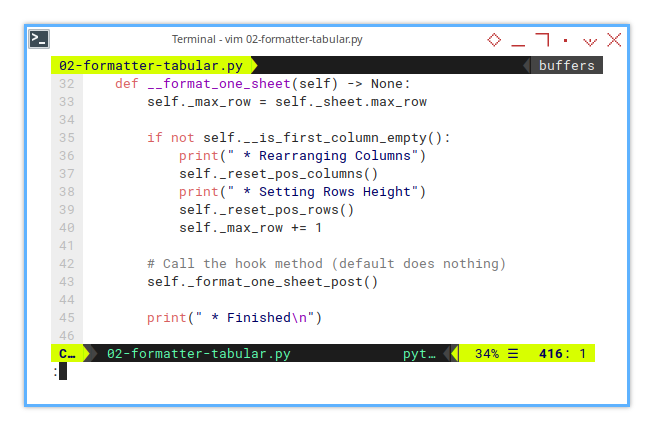
    def __format_one_sheet(self) -> None:
        self._max_row = self._sheet.max_row

        if not self.__is_first_column_empty():
            print(" * Rearranging Columns")
            self._reset_pos_columns()
            print(" * Setting Rows Height")
            self._reset_pos_rows()
            self._max_row += 1

        # Call the hook method (default does nothing)
        self._format_one_sheet_post()

        print(" * Finished\n")
The whole point of this section is to give us, a fine-tuned control over both rows and columns. With this enhanced flow, we maintain a clear structure, and the new hook method allows future extensions without breaking a sweat.
Helper: Prevent Column Rearrangement
Once is enough—don’t mess with the columns again.
The goal of this helper function is simple: ensure that column and row gap insertion only happens once. Any more, and we risk messing up our beautiful, orderly spreadsheet.
Well, we can run the formatting script, as many times as we like without worrying about mangling the layout. Colors? Fonts? Borders? Go nuts. But gaps? They stay put.
To check if gaps are already in place,
we use the __is_first_column_empty() function.
It peeks at the first few rows (we check up to row 10),
to see if the first column has already been touched.
If the column is already filled with an empty cell, it means gaps are already there, no need to insert them again.
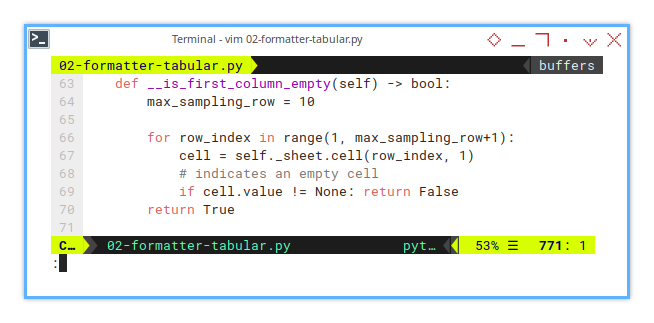
    def __is_first_column_empty(self) -> bool:
        max_sampling_row = 10

        for row_index in range(1, max_sampling_row+1):
            cell = self._sheet.cell(row_index, 1)
            # indicates an empty cell
            if cell.value != None: return False
        return True
This function ensures that the script doesn’t inadvertently re-insert gaps, preserving the order of the columns and rows after the initial setup.
Without this check, every script execution would keep adding more and more gaps, turning our sleek Excel sheet into a chaotic maze. This function prevents that madness, ensuring stability and consistency in our output.
Helper: Maximum Rows
Finding the end of the world rows
We can simlpy utilize built-in method max_row from openpyxl.
This method is essential when we’re working with dynamic data in openpyxl,
as it ensures the script adapts to any changes in the sheet’s data range.
self._sheet.max_rowIn the real world, data isn’t static (unless we’re a museum curator). This method ensures our script gracefully handles changing row counts, without breaking a sweat, or your spreadsheet.
Scaling Factor
I calculated the scaling factor through a sophisticated method, known as “trial and error”:
- Scaling factor: 29.53
Why 29.53? Honestly, I have no idea. No clue, about this one. If you figure out the cosmic truth behind this number, do let me know. Any suggestions or better calculation, would help. I’ll owe you a coffee (or at least a witty comment).
Basic Flow: Row Position
Formatter Base Class
In this step, we first ensure the height of all rows is consistent. 0.5 cm to be precise (although the multiplier may vary depending on your locale or the whims of spreadsheet physics).
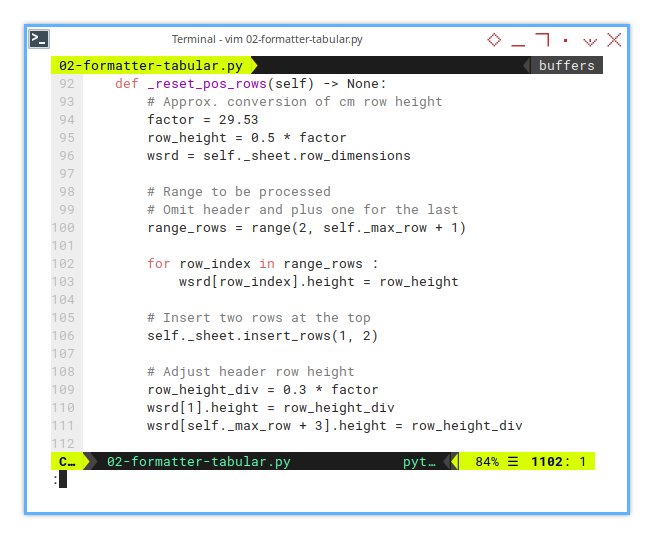
    def _reset_pos_rows(self) -> None:
        # Approx. conversion of cm row height
        factor = 29.53
        row_height = 0.5 * factor
        wsrd = self._sheet.row_dimensions

        # Range to be processed
        # Omit header and plus one for the last
        range_rows = range(2, self._max_row + 1)

        for row_index in range_rows :
            wsrd[row_index].height = row_height
After giving your rows a height makeover, we insert two rows at the top to create a column group heading, setting it to 0.3 cm for the first row, and the row after the end.
        # Insert two rows at the top
        self._sheet.insert_rows(1, 2)

        # Adjust header row height
        row_height_div = 0.3 * factor
        wsrd[1].height = row_height_div
        wsrd[self._max_row + 3].height = row_height_div
Why not add a little flair? Because neatly spaced rows make your spreadsheet easier to read, and our future self will thank us when debugging it at 2 a.m.
Breakdown
Here’s a quick recap for those skimming while sipping coffee:
-
Row Height Adjustment: Every row (from row 2 to the last) is set to 0.5 cm. This ensures uniformity across the rows. Consistency is key, unless you want your spreadsheet to resemble a chaotic art piece.
-
Inserting Gap Rows: We insert two rows at the top (index 0) and apply a 0.3 cm gap to the first and after last rows. These gap rows are intended to visually separate the table from any other content that might be above or below it. Think of it as a cozy buffer zone for your data.
-
Maintaining Simple Formatting: This setup sticks to basic row height adjustments. The formatting uses consistent 0.5 cm and 0.3 cm values for the rows. We can tweak it further if we’re feeling fancy, but for now, this clean and consistent format does the trick.
This approach keeps our sheet well-organized, with structured gaps and uniform row heights.
Ensuring the header, and yet and empty footer, are appropriately spaced. It’s like giving our spreadsheet a proper haircut—neat, tidy, and easy on the eyes.
Sheet Result
The result? Your spreadsheet should now have well-aligned rows, complete with stylish gaps. Here’s a preview of the output:
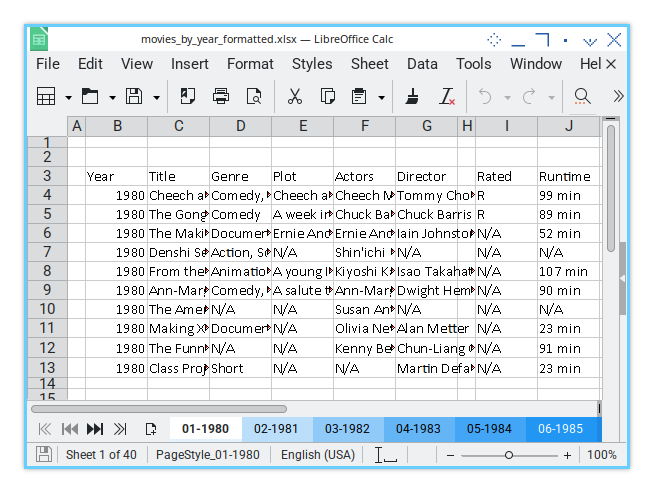
Yes, the fonts look like they escaped from the ’90s. We will tackle that horror in step eight. Patience, my friend.
Terminal Log
To keep things transparent (and to know what’s going wrong when everything inevitably does), I use simple print statements for logging. This provides real-time feedback on the script’s execution.
For this step, here’s what you’ll see in the terminal:
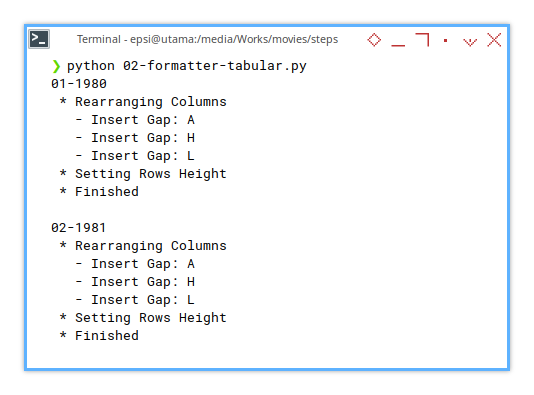
❯ python 02-formatter-tabular.py
01-1980
 * Rearranging Columns
   - Insert Gap: A
   - Insert Gap: H
   - Insert Gap: L
 * Setting Rows Height
 * Finished

02-1981
 * Rearranging Columns
   - Insert Gap: A
   - Insert Gap: H
   - Insert Gap: L
 * Setting Rows Height
 * Finished

 ...
Logs are our best friend when debugging. They give us a play-by-play of what’s happening, so we’re not left guessing why our rows are suddenly doing the Macarena.
We’ll dive deeper into the logging magic later, but for now, we’re officially a spreadsheet sorcerer.
03: Step Three
In this step, we go beyond cell-level adjustments, and introduce settings for the entire sheet. This includes freezing columns and rows, as well as managing gridlines.
Why bother with this?
Well, while gridlines are like training wheels for data entry, helpful but clunky, they can turn a professional report into a chaotic mess. Plus, freezing panes keeps your headers in view, while you scroll through the spreadsheet abyss. This step is all about making your sheet both cleaner and easier to navigate.
Step Overview
This section covers the following topics:
- Formatting Procedure: Show grid, Freeze panes
These tweaks may seem cosmetic, but they elevate the user experience, by enhancing both visual clarity and usability.
Script Source
You can find the script source in this repository:
Feel free to browse it, copy it, or marvel at its beauty.
Class Diagram
Yes! We’re adding the _set_sheetwide_view() method.
This method handles sheet-level formatting,
and is highlighted in the class diagram below.
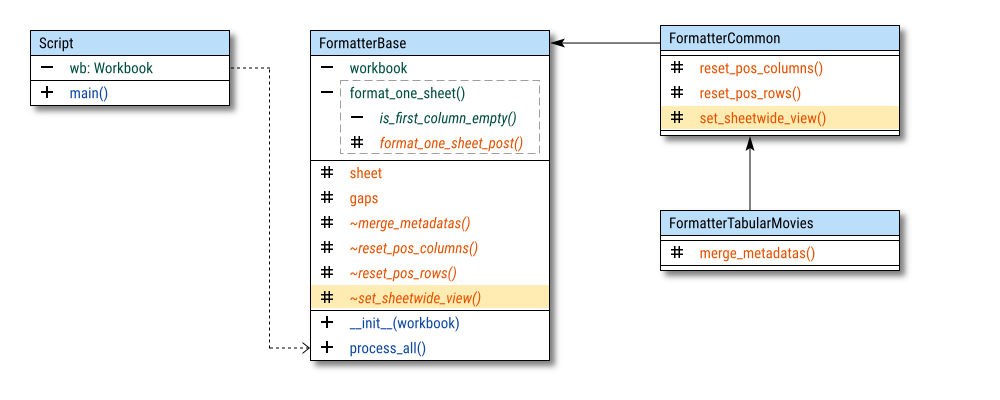
Like a good detective novel, the diagram reveals the new twist, while keeping the familiar characters (methods) intact.
Abstract Method
Just write the abstract.
And here it is, our newest addition to the abstract method club:
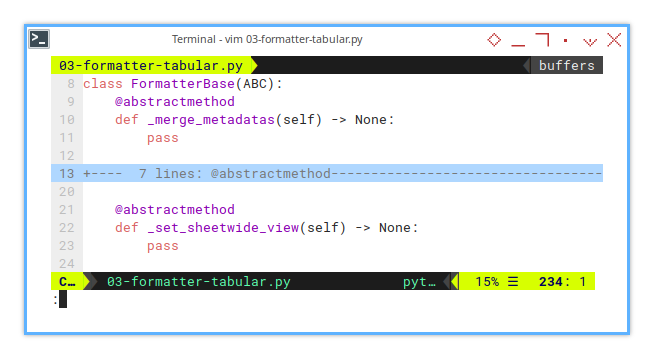
class FormatterBase(ABC):
    @abstractmethod
    def _merge_metadatas(self) -> None:
        pass

    ...

    @abstractmethod
    def _set_sheetwide_view(self) -> None:
        pass
This method allowing us to extend the base class without breaking a sweat. With it in place, we’re ready to take sheet-wide control like a spreadsheet overlord.
Basic Flow
Formatter Base Class
With the abstract method in place, we can summon it right in the heart of the base class. No secret handshakes required.
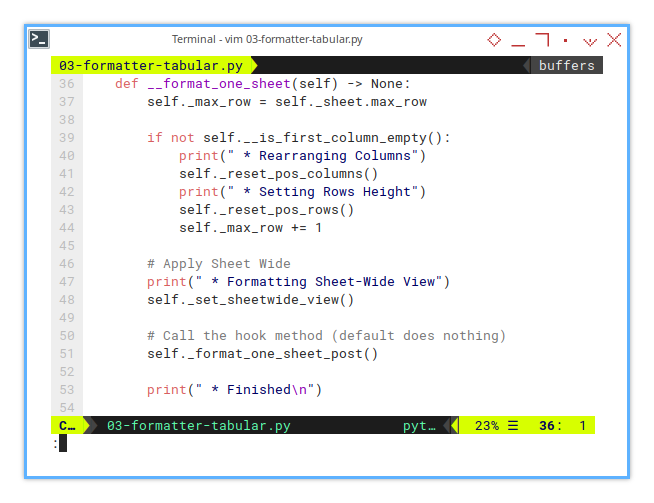
    def __format_one_sheet(self) -> None:
        self._max_row = self._sheet.max_row

        if not self.__is_first_column_empty():
            print(" * Rearranging Columns")
            self._reset_pos_columns()
            print(" * Setting Rows Height")
            self._reset_pos_rows()
            self._max_row += 1
And now, for the grand finale, the sheet-wide formatting:
        # Apply Sheet Wide
        print(" * Formatting Sheet-Wide View")
        self._set_sheetwide_view()

        # Call the hook method (default does nothing)
        self._format_one_sheet_post()

        print(" * Finished\n")
This approach keeps the process modular, while giving you the power to customize, the sheet’s macro-level aesthetics.
Configuration: Freeze
Why stop at columns and rows when you can freeze time.
Well, at least parts of the sheet?
Here, we add a self._freeze variable to the child class,
which the base class will obediently process.
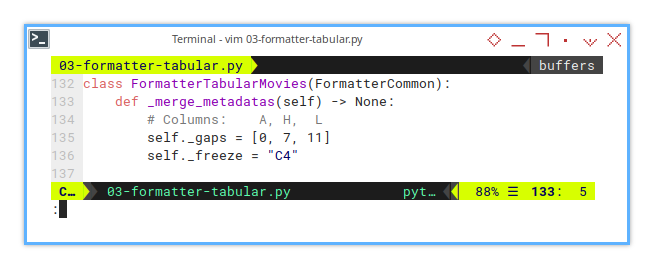
class FormatterTabularMovies(FormatterCommon):
    def _merge_metadatas(self) -> None:
        self._gaps = [0, 7, 11]
        self._freeze = "C4"
With this setup, you can configure a different freeze position, for each worksheet flavor, because variety is the spice of life.
Formatting: Sheetwide View
The implementation is stored in base class.
The heavy lifting happens here,
inside the _set_sheetwide_view() method.
This is where we fine-tune the big picture.
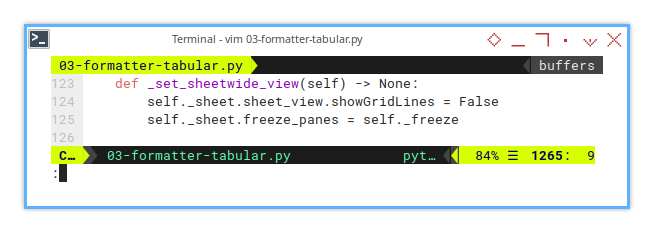
    # Formatting Procedure: Abstract Override
    def _set_sheetwide_view(self) -> None:
        # Disable gridlines
        self._sheet.sheet_view.showGridLines = False

        # Freeze at position C3 (Column 3, Row 3
        self._sheet.freeze_panes = self._freeze
Now we can use different placement of freeze, for each sheet formatting variant. Readability boost, clarity wins, configurable freedom.
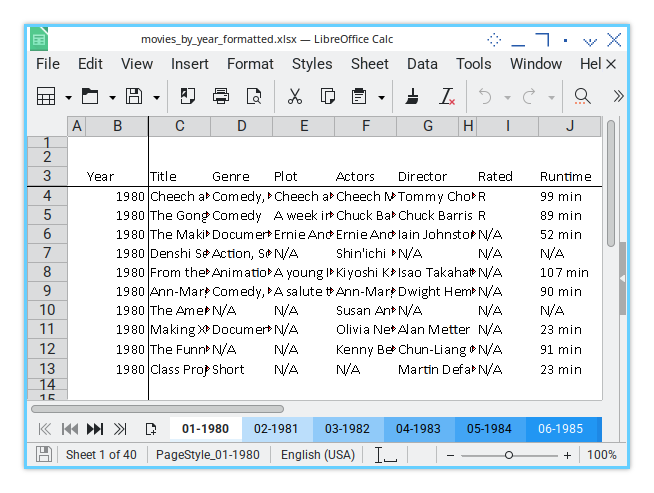
Sheet Result
The resulting sheet will look as shown below, cleaner, sharper, and with a frozen header to keepus grounded:
Terminal Log
The terminal output is your trusty sidekick, letting you track the magic as it happens. Here’s how it looks for this step:
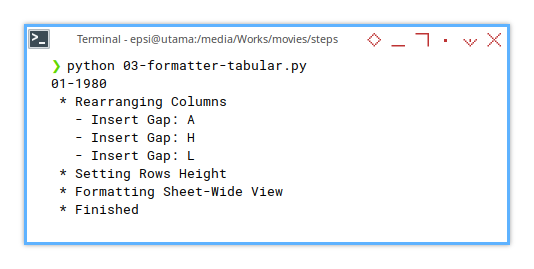
❯ python 03-formatter-tabular.py
01-1980
 * Rearranging Columns
   - Insert Gap: A
   - Insert Gap: H
   - Insert Gap: L
 * Setting Rows Height
 * Formatting Sheet-Wide View
 * Finished

 ...
This logging approach not only helps with debugging, but also gives us a satisfying play-by-play of the script’s handiwork.
And that’s a wrap for step three. our spreadsheets are now gridline-free zones, with rock-solid headers!
Onward to the next layer of formatting wizardry.
What is Next 🤔?
So, we have conquered sheet-wide formatting—frozen panes, hidden gridlines, and all. What’s next? We’re diving deeper into the world of unified configuration, and unlocking the full power of Excel formatting magic.
Buckle up, things are about to get even more interesting.
Feel free to keep reading [ Formatter - Excel Config - Three ], because the nerdy ride is just beginning!