Preface
Goal: Overview of daily office task automation, from merging CSV files to formatting complex, multi-tab spreadsheets.
Spreadsheets are essential for clear communication, allowing anyone reading our reports to easily interpret the data. But let’s face it, formatting them manually feels like, rearranging deck chairs on the Titanic (except the ship is fine, and you’re just wasting precious time).
Skill Gap
Automation Skill in Industry
When formatting becomes part of your workflow, automating it is the next logical step. Automation not only saves time, but also helps maintain consistency across reports.
Think of it like being a server admin who scripts tasks in BASH. They save hours of tedious work, impress their boss and might just land that raise. The good news? Spreadsheet automation is far more accessible, no command-line wizardry required. Anyone using spreadsheets daily can, level up their workflow with a little automation magic.
In Brief
What’s this all about?
Let’s be real—this article series isn’t, for anyone chasing viral 60-second clips. It’s long, detailed, and meant for those who enjoy diving deep.
But I get it, sometimes you just want a quick demo. Here’s a brief, no-nonsense demonstration (clocking in at a brisk 86 seconds), so you know what it does.
Reading these article series require concentration. People skim surface-level stuff but will sit for hours for with quality and depth if they find something compelling.
Being viral is not my goal.
Journey Maps
Formatter Configuration Series
The journey path contains multiple steps in order.
- Basic Flow
- Setting Column Width and Gaps
- Setting Row Heights and Gaps
- Sheetwide View
- Configuration Basics
- Merged Title
- Header Borders and Colors
- Data Borders
- Data Colors
- Reusable Library
Formatting Automation
This is all about automation
Spreadsheet skills are essential in modern jobs, and a well, formatted worksheet makes, your content easier to read (and harder to ignore). While the content itself matters most, adding a layer of visual appeal can transform a basic report, into something that actually grabs attention.
Good reporting doesn’t just present results, it can push your team ahead. Think of your spreadsheet as more than just a table of data. It’s a communication tool. When done right, you’re not just showing numbers; you’re proposing ideas.
The secret? Small details, everywhere. Header colors, fonts, borders, row height, column width, numbering, and alignment… It all adds up. Once you lock in your formatting style, you can roll it out across every sheet you touch. Formatting becomes a habit, and suddenly, you look like the pro who has it all together.
The best part? You can automate it. Automation streamlines your workflow, saving time and effort. When you’re dealing with massive amounts of data, automation can cut down what used to take a week into just a few hours. That means more time for higher-priority tasks, and less time fiddling with cells.
Let automation handle the formatting, and you can focus on the work that really matters.
In Data Science
When working with data, Jupyter Notebook is your best friend. But when dealing with your boss or clients? A simple spreadsheet rules the world.
Sure, you might think Jupyter is easy—filtering, sorting, pivoting dataframes like a pro. But guess what? Your boss doesn’t care. They just want to scroll through Excel.
Here’s the catch,
Excel (or Calc) taps out when things get heavy.
VLOOKUP slows to a crawl, and pivot tables feel..
well, ancient compared to dataframes.
The solution? Separate the workflow:
- Heavy lifting: Crunch the data with Python. CSV in, CSV out.
- Polishing: Use LibreOffice Macros to format the results into .ods or .xlsx.
Let Python handle the grunt work, and let your spreadsheet shine when it’s showtime.
Configuration
Upskill
To tackle the challenges above, we need to simplify different use cases with configuration.
This series isn’t just about spreadsheet formatting, it’s about embedding configuration into Python code using classes. We’ll explore how to evolve from simple configurations to a streamlined approach using unified configuration.
By the end, you’ll not only have prettier spreadsheets, but also smarter, more maintainable code.
Why This Article?
The fact that the macro works doesn’t mean it’s good enough.
For me, documentation is essential. Writing code for myself and for others are two very different things. I need to think through the logic a dozen times, test it over and over, and create diagrams such as class diagrams, package diagrams, to visualize the flow. Once I lay my code out in a diagram, any inconsistencies become glaringly obvious, giving me the chance to fix flaws in my logic before they turn into bigger problems.
Then comes the readability. It’s not just about adding comments, it’s about writing concise, clear code. After all these steps, I end up with code that’s not only functional but also easier to maintain.
With better code in hand, I can use it in production for my daily office tasks. It’s far easier to work with clean, tidy code than a messy one. As an employee or business partner, this makes me more productive.
This process is a complete cycle. I follow it for nearly all my projects. Not everything in this article series needs to be, as formal as my internal company documentation, but the principles are the same.
In short: I need good code for myself.
Topics
This article series will take you through the following steps:.
- Preparation
- Generating example CSV data
- Merging CSV data into a spreadsheet
- Coloring tabs as a bonus
- Formatting Data
- Simple Configuration: 9 steps to get started
- Unified Configuration: 9 steps to streamline your process
Steps Screenshot
First, we need some example CSV data.
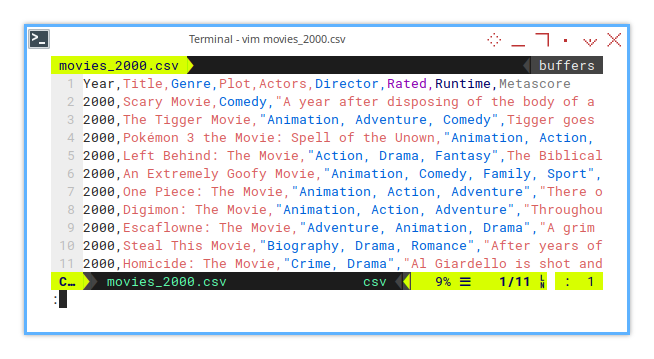
Next, we can open this CSV in LibreOffice.
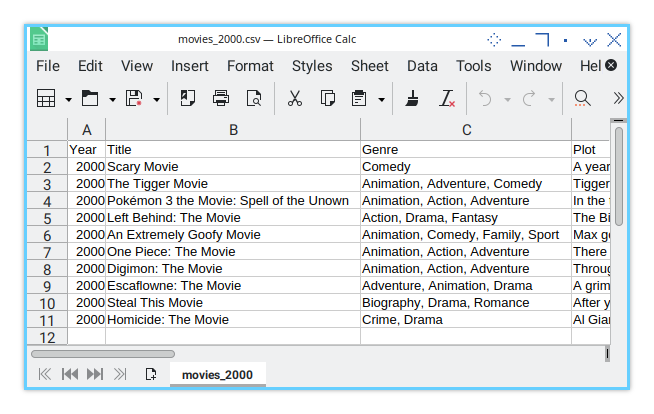
Once it’s open, we can use a macro in LibreOffice, to format the data easily.
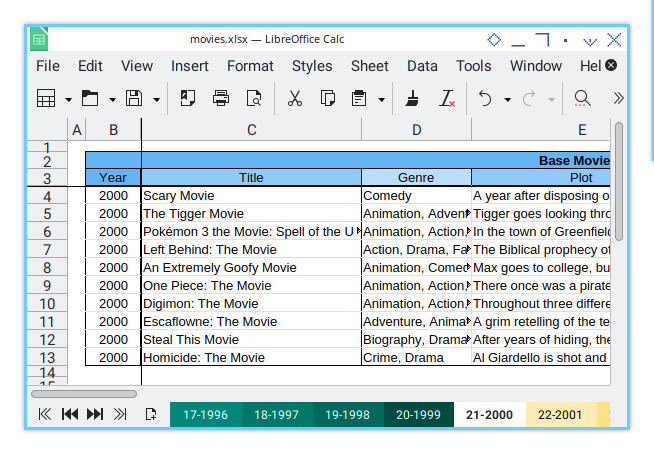
But it’s not just about basic formatting, we can control more details.
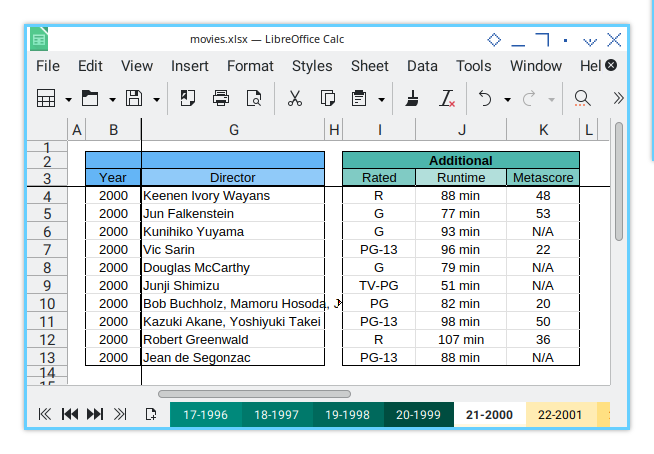
Example Configuration
The configuration would be as simple as below:
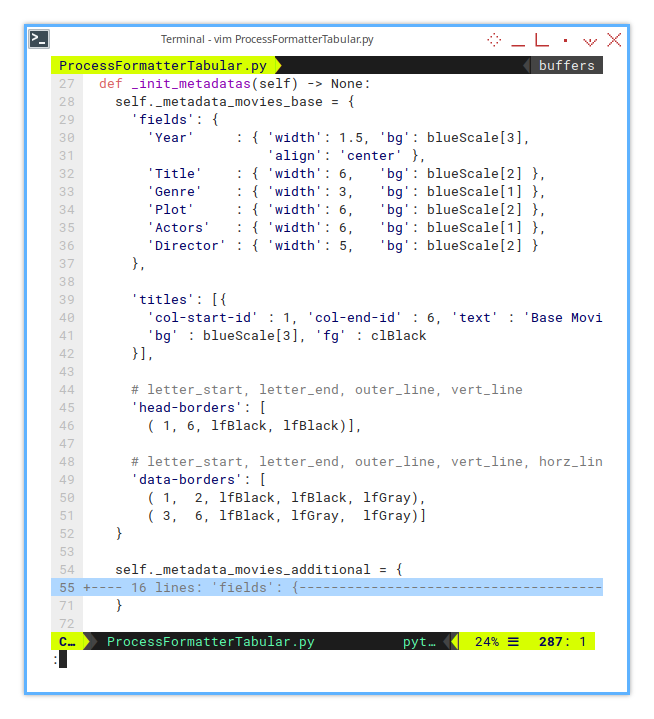
  def _init_metadatas(self) -> None:
    self._metadata_movies_base = {
      'fields': {
        'Year'     : { 'width': 1.5, 'bg': blueScale[3],
                       'align': 'center' },
        'Title'    : { 'width': 6,   'bg': blueScale[2] },
        'Genre'    : { 'width': 3,   'bg': blueScale[1] },
        'Plot'     : { 'width': 6,   'bg': blueScale[2] },
        'Actors'   : { 'width': 6,   'bg': blueScale[1] },
        'Director' : { 'width': 5,   'bg': blueScale[2] }
      },

      'titles': [{
        'col-start-id' : 1, 'col-end-id' : 6, 'text' : 'Base Movie Data',
        'bg' : blueScale[3], 'fg' : clBlack
      }],

      # letter_start, letter_end, outer_line, vert_line
      'head-borders': [
        ( 1, 6, lfBlack, lfBlack)],

      # letter_start, letter_end, outer_line, vert_line, horz_line
      'data-borders': [
        ( 1,  2, lfBlack, lfBlack, lfGray),
        ( 3,  6, lfBlack, lfGray,  lfGray)]
    }

    self._metadata_movies_additional = {...}
Formatting Steps for Simple Configuration
As mentioned earlier, the nine steps of formatting are the core of this article.
I’m experimenting with an OOP design pattern, implementing each step with careful consideration.
-
Step One
- Class: FormatterBase, TabularFormatterCommon
- Basic Flow: Working with multiple sheets
- Formatting Procedure: Insert column gap
-
Step Two:
- Helper: Last Row
- Helper: Prevent Re-inserting Column
- Formatting Procedure: Insert row gap, set row height
-
Step Three
- Abstract Method
- Formatting Procedure: Show grid, Freeze panes.
-
Step Four
- Initialization: Prepare Sheet
- Configuration: Field Metadata Configuration
- Initialization: Prepare Sheet
- Helper: Column Letter to Index
- Helper: Number Formats
- Formatting Procedure: Format Columns
-
Step Five
- Helper: Format Cell Rectangle
- Predefined Constant: Color Scale (GMC)
- Predefined Constant: Line Format
- Formatting Procedure: Add merged title
-
Step Six
- Helper: Get head range, set head rectangle, apply head border
- Formatting Procedure: Format head border
- Formatting Procedure: Format head colors
-
Step Seven
- Helper: Get data range, set data rectangle, apply data border
- Formatting Procedure: Format data border
-
Step Eight
- Helper: Row coloring
- Formatting Procedure: Groups coloring
- Basic Flow: Overriding basic flow
-
Step Nine
- Separating class into libraries
I’m also experimenting with compact UML diagrams, to represent the code more efficiently. Instead of traditional legends, I’m using symbols:
- «private»: -
- «protected»: #
- «public»: +
- «abstract»: ~ italic
- «hook»: italic
Here’s a conceptual class diagram that represents the code. Don’t worry about the complexity, we’ll break it down step by step.
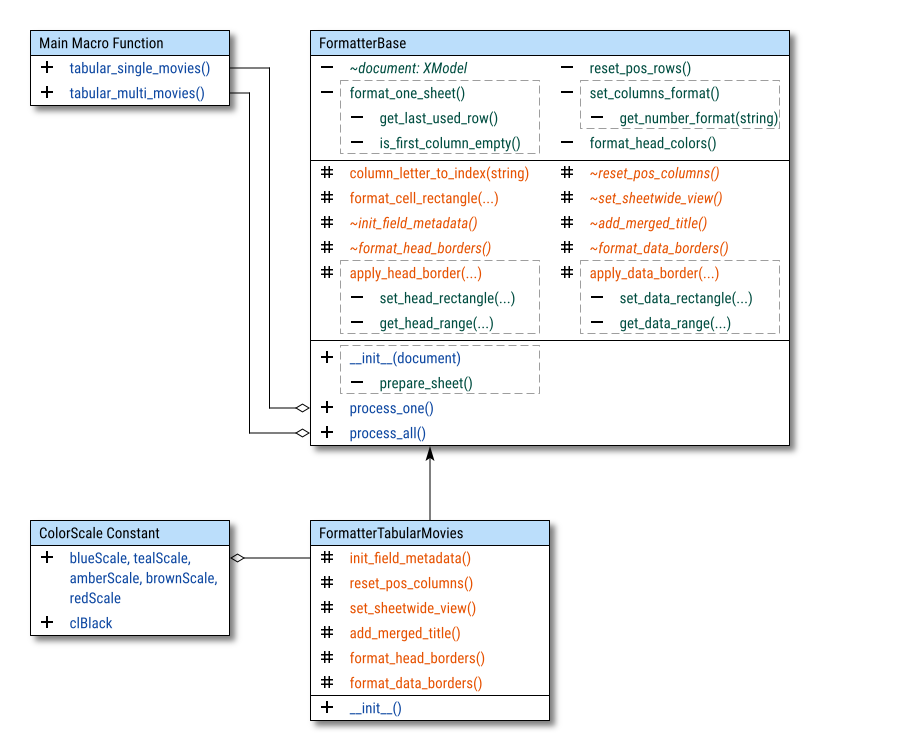
The actual code deviates slightly from the ideal concept for a few reasons It works well in practice, but the class diagram needs some adjustments. The base class is a bit overcrowded, and I’ll address that in the next class diagram.
Formatting Steps for Unified Configuration
Complex projects require a lot of configuration. To manage this complexity, we need to simplify things where possible.
As mentioned earlier, the nine steps of formatting remain the same, but now with additional methods and a simplified coloring procedure. This simple procedure becomes more complex when integrated into a unified configuration.
-
Step One
- Class: FormatterBase,FormatterCommon, FormatterTabularData, FormatterTabularMovies
- Configuration: Merge Metadata
- Similar to Previous
-
Step Two:
- Similar to Previous
-
Step Three
- Class: FormatterTabular
- Similar to Previous
-
Step Four
- Helper: Get Relative Column Letter
- Formatting Procedure: Format Columns (multiple block of columns)
- Similar to Previous
-
Step Five
- Class: BorderFormatManager
- Formatting Procedure: Add merged titles (multiple block of columns)
- Formatting Procedure: Set merge title (refactored for one block)
- Formatting Procedure: Add merged titles post (Hook)
- Similar to Previous
-
Step Six
- Formatting Procedure: Format head borders (multiple block of columns)
- Similar to Previous
-
Step Seven
- Formatting Procedure: Format data borders (multiple block of columns)
- Similar to Previous
-
Step Eight
- Similar to Previous coloring cells.
- Basic Flow: Using hook instead of messing with basic flow
-
Step Nine
- Separating class into libraries.
The conceptual representation of the refactored code for the unified configuration is summarized in the class diagram below. This shows how we can automate sheet formatting, starting with a simple class that rearranges columns, and works for both single and multiple sheets.
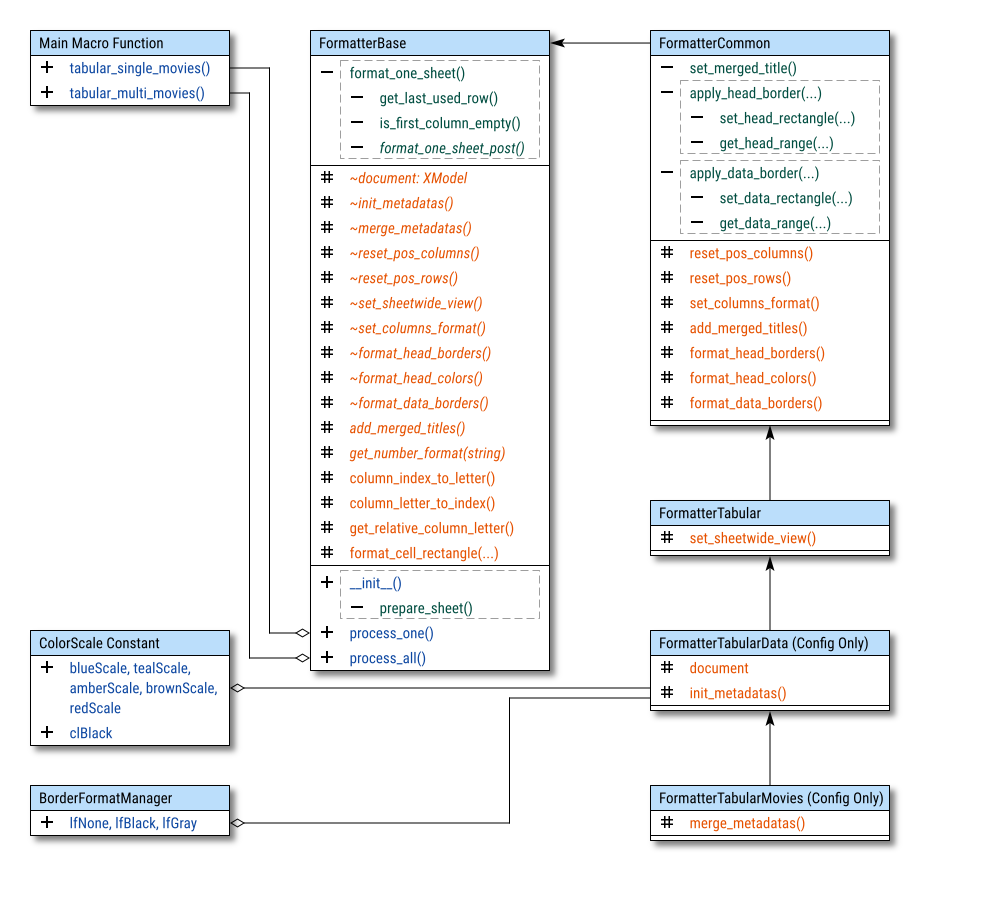
This diagram is much clearer now. Diagramming is essential for checking your own code. The process is back and forth, from code to diagram and vice versa, and we should make this a regular practice.
We should do it often.
Example Data
For learning purposes, we’ll use IMDb movie data as an example. We can fetch movie data using the OMDB API.
Column Header
For this example, we will fetch the following columns:
- Year
- Title
- Genre
- Plot
- Actors
- Director
- Rated
- Runtime
- Metascore

Year,Title,Genre,Plot,Actors,Director,Rated,Runtime,MetascoreReady to Use Data
Rows in CSView
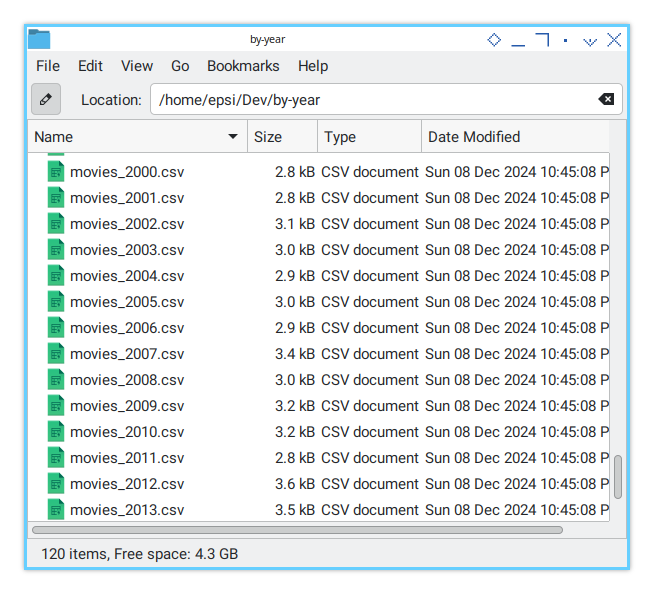
I’ve prepared an example dataset for you, so there’s no need to generate a new one.
With CSView the data will looks like below:
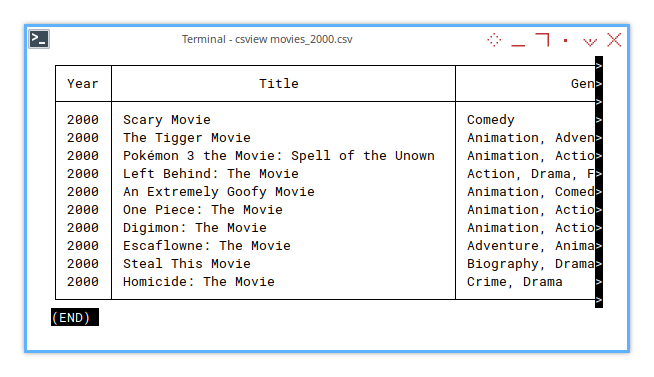
This dataset contains movies from the year 1900 to 2020.
Just for fun, I’ve filtered the output,
to show only titles that contain the word movie.
Now, we’re ready to use the data!
Data Generator
Movie keyword
If you prefer, you can generate your own data. The script to generate this data is available here:
You can explore the fetcher script, and modify it to include the columns you need.
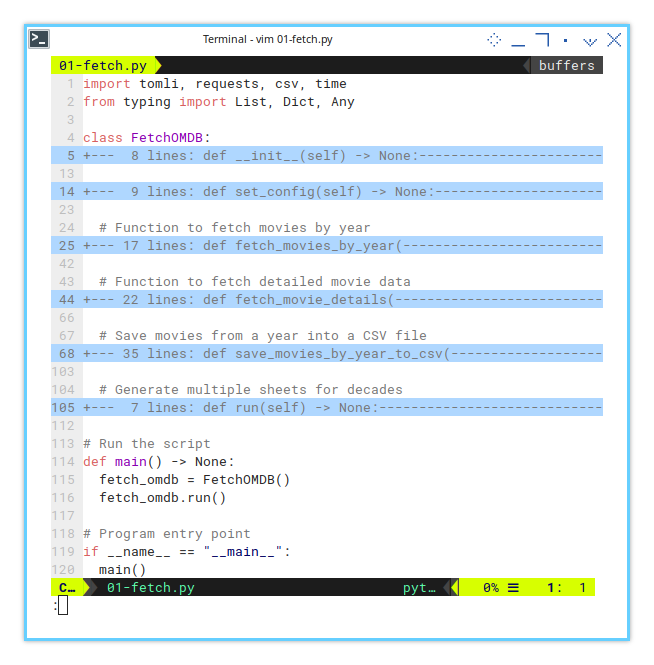
To use the script, you’ll need to obtain,
an API key from OMDB and place it in secret.toml.
However, you probably won’t need this script,
as I’ve already provided the example data for you.
The only reason you might need it is if you want,
a different list with titles containing something other than movie.
Merge All
Use this neat trick for combining CSVs!
cat header.csv > movies_all.csv && tail -n +2 -q $(ls by-year/movies_*.csv | sort) >> movies_all.csvWe’ll need the combined data for the final step: coloring rows by group.
FAQ
These below applied to other articles as well.
Why Not Monetize It?
The question itself, already hurt my feeling.
On many occasions, some of my not techie friend wondering, why I do not monetize this thing. Not just this mini project, but other article as well, then get fat and rich? This question is setting my bar too low, since making this script is not that hard. This is just a macro, and nothing more. The hard part is making the article itself. But I guess I have to speak-up sometimes.
Life is not just about money. Even when I really in need, okay. The value isn’t always monetary. It can be in credibility, reputation, or just the satisfaction of sharing something useful.
Plus, coders love tinkering with these sorts of things. Monetizing it might narrow the audience to just those willing to pay, whereas sharing it freely can build connections, spark collaborations, and keep the door open for future opportunities.
It’s kind of like making a big pot of instant noodles, throwing in some eggs and frozen dumplings, and sharing it with friends instead of selling bowls at a stall. The warmth and connection from sharing often come back in unexpected ways, sometimes far more valuable than any cash we might earn directly.
I don’t want to be harsh, but I must smile and wisely say:
I’d rather build something people can’t live without,
than charge for something they can code in a weekend.
Topic By Request
I’m not shutting the door.
A friend recently asked why I don’t write articles, on topics that could be useful for them. Let me give an honest and heartfelt response. I think a lot of creators feel the same way, but rarely say it out loud.
Honestly, life is already pretty demanding. I work from eight in the morning until eleven at night, every working day. I barely have time to breathe, let alone write everything I want to. I have dozens of pending articles that I need to prioritize. And all should be done outside office hours, mostly at home, so I can share these articles freely.
When I began blogging, I had this big dream that more people would write, and share their knowledge, so we could all learn from each other. I’m not here to push the idea that everyone should write, but it does feel like a moral question.
If someone really wants to see certain articles, maybe that’s their sign to stop waiting and start creating. Writing takes time, just like anything worthwhile. And if I’ve learned anything, it’s that relying on yourself to get things done, is often the best place to start.
I’m encouraging you to step up.
What is Next 🤔?
Before diving into the code in the formatter class, we need to merge the example data into a workbook. The goal is to combine these CSV files into a single workbook using a macro, which is an essential step before applying the formatting and processing discussed earlier.
You can continue reading [ Formatter - Config - Merge CSV ] to learn more about this next step and how to use a macro for merging CSV data into one workbook.