Preface
Goal: Prepare data structure for plot a bar chart.
Prepare
Do not Rush! As mentioned in previous article.
The issue with barchart is preparing data structure, that can be read by human easy. We will have matrix as the data structure, and tranpose the matrix later using numpy.
The other stuff has been explained in matplotlib official stuff.
Preview
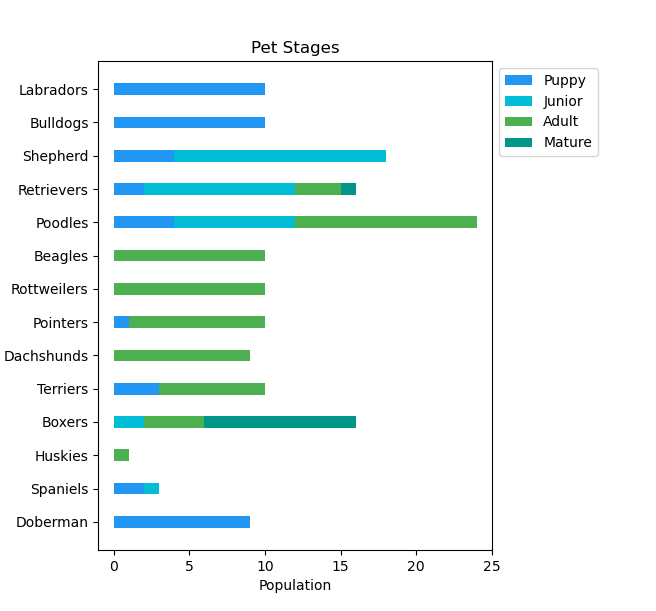
The final result would be as below:
1: Data Structure
Consider data structure as a starting point.
We are going to use dog breeds as our data structure.
Simple Example
To represent dog’s age we can use array, in which represent:
- Puppy
- Junior
- Adult
- Senior
stages = [3, 2, 3, 4]Script
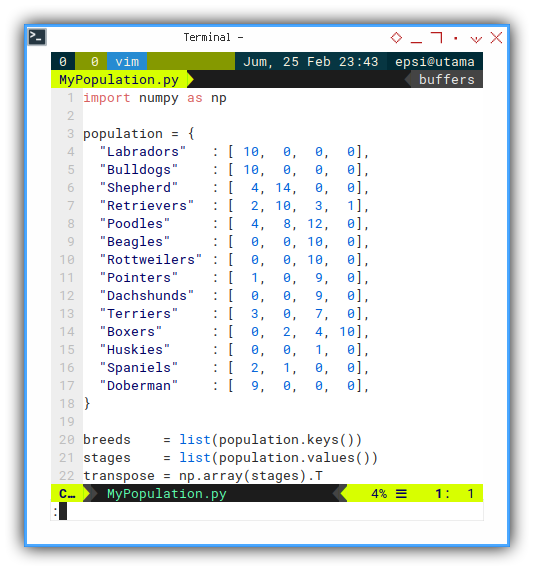
For multiple breed, we can utilize dictionary. The python script is simple:
population = {
  "Labradors"   : [ 10,  0,  0,  0],
  "Bulldogs"    : [ 10,  0,  0,  0],
  "Shepherd"    : [  4, 14,  0,  0],
  "Retrievers"  : [  2, 10,  3,  1],
  "Poodles"     : [  4,  8, 12,  0],
  "Beagles"     : [  0,  0, 10,  0],
  "Rottweilers" : [  0,  0, 10,  0],
  "Pointers"    : [  1,  0,  9,  0],
  "Dachshunds"  : [  0,  0,  9,  0],
  "Terriers"    : [  3,  0,  7,  0],
  "Boxers"      : [  0,  2,  4, 10],
  "Huskies"     : [  0,  0,  1,  0],
  "Spaniels"    : [  2,  1,  0,  0],
  "Doberman"    : [  9,  0,  0,  0],
}
It is easier to represent the data this way.
Extracting Data
To get each breed names and each stages,
are just getting the key-value for each dictionary.
import numpy as np

population = {
  "Labradors"   : [ 10,  0,  0,  0],
  ...
}

breeds    = list(population.keys())
stages    = list(population.values())
Tranpose
The stages is a two dimensional array. We can easily transpose the matix using numpy.
breeds    = list(population.keys())
stages    = list(population.values())
transpose = np.array(stages).T
Statistic
Seems like basic statistic right? But no. We haven’t get there yet.
This article only discus the vizualization stuff.
2: Using Population Data
Test the data in CLI, before jump into chart.
Pretty Print
Since in real world we have to deal with a lot of data. It is wise to setup pretty print. So we can read and then examine the result easily, without hurting your good retina.
Breeds
Consider begin with breed names.
import pprint
from MyPopulation import breeds, stages, transpose

my_print = pprint.PrettyPrinter(
  width=54, compact=True)
my_print.pprint(breeds)
Run the script above. This will show you this below:
❯ python 01-matrix-a.py['Labradors', 'Bulldogs', 'Shepherd', 'Retrievers',
'Poodles', 'Beagles', 'Rottweilers', 'Pointers',
'Dachshunds', 'Terriers', 'Boxers', 'Huskies', 'Spaniels',
'Doberman']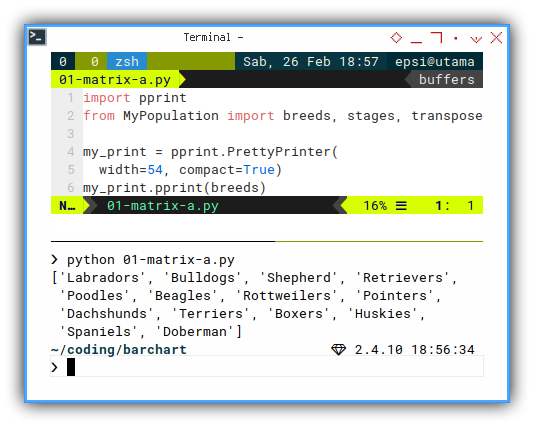
Stages
Then continue with stages. We will get matrix.
import pprint
from MyPopulation import breeds, stages, transpose

my_print = pprint.PrettyPrinter(
  width=54, compact=True)
my_print.pprint(stages)
Run the script above. You will get this two dimensional array with pretty print.
❯ python 01-matrix-b.py
[[10, 0, 0, 0], [10, 0, 0, 0], [4, 14, 0, 0],
 [2, 10, 3, 1], [4, 8, 12, 0], [0, 0, 10, 0],
 [0, 0, 10, 0], [1, 0, 9, 0], [0, 0, 9, 0],
 [3, 0, 7, 0], [0, 2, 4, 10], [0, 0, 1, 0],
 [2, 1, 0, 0], [9, 0, 0, 0]]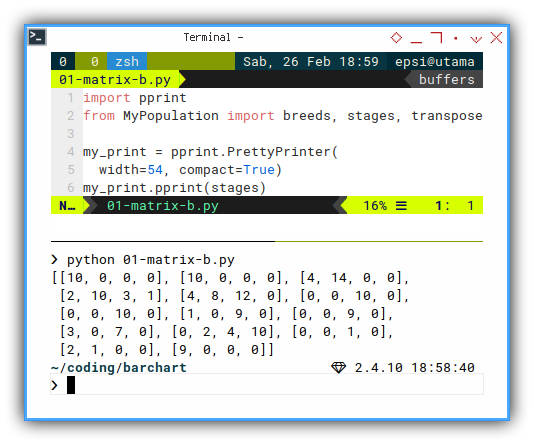
Transposed Stages
And also the transposed matrix of the dog breeds population.
stages    = list(population.values())
transpose = np.array(stages).Tfrom pprint import pprint
from MyPopulation import breeds, stages, transpose
pprint(transpose)Run the script above. You will get this two dimensional array with pretty print.
❯ python 01-matrix-c.py
array([[10, 10,  4,  2,  4,  0,  0,  1,  0,  3,  0,  0,  2,  9],
       [ 0,  0, 14, 10,  8,  0,  0,  0,  0,  0,  2,  0,  1,  0],
       [ 0,  0,  0,  3, 12, 10, 10,  9,  9,  7,  4,  1,  0,  0],
       [ 0,  0,  0,  1,  0,  0,  0,  0,  0,  0, 10,  0,  0,  0]])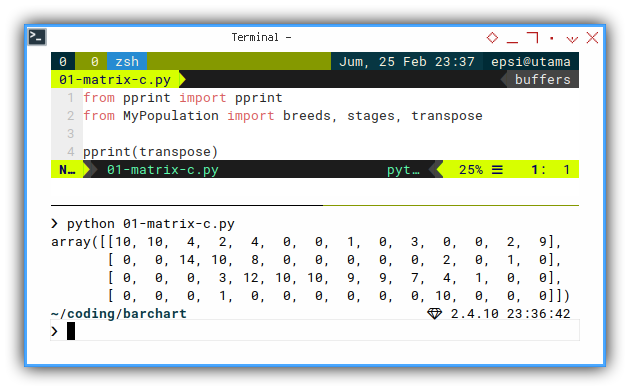
3: Getting Each Stages
We are almost done. Now we can have each stages of dog breed population.
Extracting Stages
Just get the stages by array index.
from pprint import pprint
from MyPopulation import breeds, stages, transpose

puppy  = transpose[0]
junior = transpose[1]
adult  = transpose[2]
mature = transpose[3]

pprint(puppy)
pprint(junior)
pprint(adult)
pprint(mature)
Run the script above. You will get these one dimensional array of each four stage.
❯ python 01-matrix-d.py
array([10, 10,  4,  2,  4,  0,  0,  1,  0,  3,  0,  0,  2,  9])
array([ 0,  0, 14, 10,  8,  0,  0,  0,  0,  0,  2,  0,  1,  0])
array([ 0,  0,  0,  3, 12, 10, 10,  9,  9,  7,  4,  1,  0,  0])
array([ 0,  0,  0,  1,  0,  0,  0,  0,  0,  0, 10,  0,  0,  0])
Desrtructuring Stages
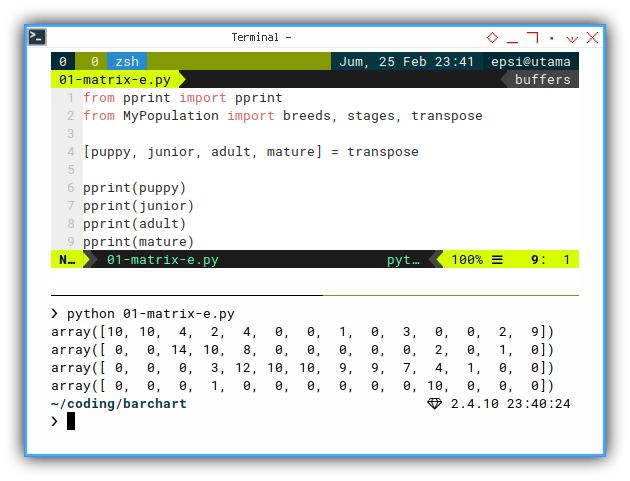
It is easier to extract using destructuring syntax.
from pprint import pprint
from MyPopulation import breeds, stages, transpose

[puppy, junior, adult, mature] = transpose

pprint(puppy)
pprint(junior)
pprint(adult)
pprint(mature)
Run the script above. You will get about the same result.
4: Material Colors
The colors
just like our pie chart, I set up material color variable in its own module.
Script
In order to keep my code clean. I put the name of each color as dictionary. The python script as usual:
material = {
  'red500'   : '#F44336',
  'pink500'  : '#E91E63',
  'purple500': '#9C27B0',
  'indigo500': '#3F51B5',
  'blue500'  : '#2196F3',
  'cyan500'  : '#00BCD4',
  'teal500'  : '#009688',
  'green500' : '#4CAF50',
  'lime500'  : '#CDDC39',
  'orange500': '#FF9800'
}
Very simple, and reuasble between barchart.

That is all with colors.
What is Next 🤔?
Data structure is fun, but we have to move on.
Consider continue reading [ Matplotlib - Bar Chart - Part Two ].