Preface
Goal: Begin from scratch.
This is a multipart article:
- Begin from scratch.
- Initialization and conditional optimization.
- Refactoring to object oriented.
- Writing the xslx sheet.
From the very start, this is not only an explanation, on how to handle worksheet. But rather, a step by step real life example, of building macros from scratch.
Most of the part is modelling the internal data, without writing to sheet at all. With strong backend, we can go further to other case, other than pivot, such as statistical analysis and such.
However, we need a simple case. So I humbly present you my reader, the pivot case.
Why Pivot?
My boss said summary.
I have weekly report to be delivered to management. This include a bunch of pivot table and charts.
Why Custom Script?
Just like Excel, LibreOffice Calc can manage pivot table. But just like Excel, Calc can only manage one data source at a time. If I should compare between data source, I should make the pivot one by one, and copy-paste the result.
It is a daunting process, and also error prone. So I decide to make my own multicolumn pivot generator.
Why Python?
It has openpyxl
Python also has bigger ecosystem. Large community base.
What Source?
The Puppy Case.
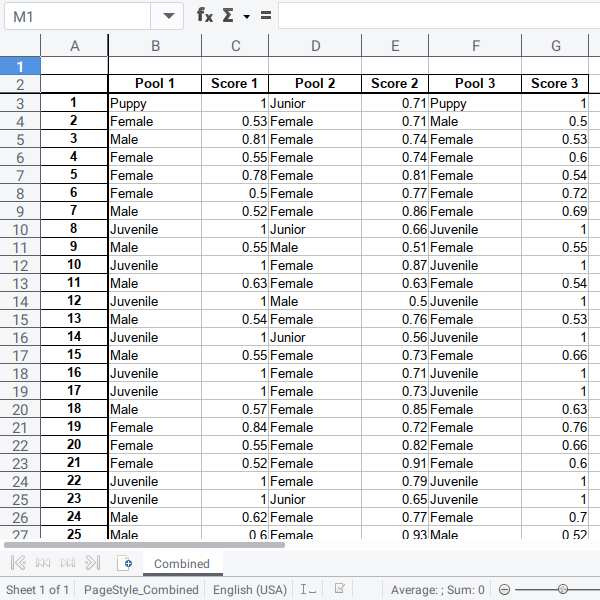
Imagine a case, you have three cameras that could identify dogs, by gender and age, and also with the confidence score.
All cameras identify the length of the dog, if the dog is short, it simply puppy without probabilty. Otherwise it is an adult dog, that could be female or male, with probability. Between adult and puppy there is other category as well.
Each camera come from different vendor,
thus different terminology.
The first and the third use the junior word with probability.
While the second camera use juvenile word without probability.
You can build a custom multicolumn pivot table. Then manually copy the format from a template, to get nice gradient looks as below worksheet.
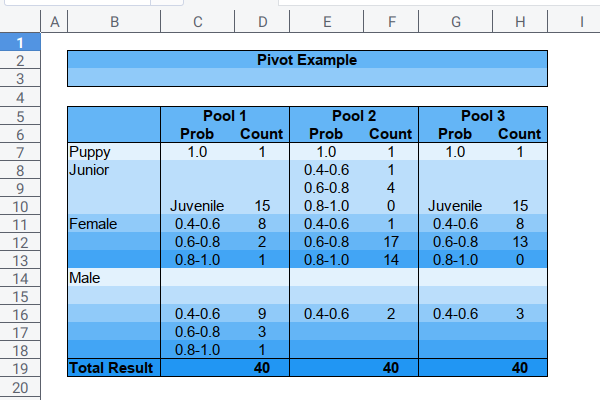
The figure above is a simplification of real data.
Example Data
You can download here
The Process
I’m making the output mockup first. And code later.
You can download the result here.
I mostly code, after making output model. The output could be changed later, as the code process begun.
Why Automation?
Time savings.
We should invest on thinking, rather than doing tedious repetitive task.
1: Code from Scratch
Apologize for my ignorance. I never have a proper IT education. Nor algorithm course.
So I what I do is just start coding. And see what I can do after. Just type, and then optimize whatever comes.
Have a look at this source code.
Opening Workbook
Most of the time, starting is scary. So I push myself to open workbook.
import openpyxl
from openpyxl import load_workbook

wb = load_workbook('recap.xlsx')
ws = wb["Combined"]
Defining Variables
The next step is defining what variable that I need. I guess the need of this variables from the colored output above.
puppy      = 0
juvenile   = 0
junior_04  = 0
junior_06  = 0
junior_08  = 0
female_02  = 0
female_04  = 0
female_06  = 0
female_08  = 0
male_02    = 0
male_04    = 0
male_06    = 0
male_08    = 0
total      = 0
Walk The Loop
I scan each row of the sheet for this two variable:
- Row
B: Prediction - Row
C: Probability
# start: 3
# end:  43
rows = range(3, 43)
for row in rows:
  pred_col = ws['B'+str(row)]
  prob_col = ws['C'+str(row)]

  pred = pred_col.value
  prob = float(prob_col.value)
This would take two level conditional.
The outer just based on prediction,
and the inner count its probability.
Outer Conditional
The skeleton of the outer conditional is as below
  if pred=='Female':
    # ...
  elif pred=='Male':
    # ...
  elif pred=='Junior':
    # ...
  elif pred=='Juvenile':
    juvenile += 1
  elif pred=='Puppy':
    puppy += 1
There is three prediction that require probability.
- Female
- Male
- Junior
Inner Conditional
The three inner conditional is very similar.
Don’t worry if the code below looks stupid. We will optimize later.
- Female
  if pred=='Female':
    if (0.2 <= prob < 0.4):
      female_02 += 1
    elif (0.4 <= prob < 0.6):
      female_04 += 1
    elif (0.6 <= prob < 0.8):
      female_06 += 1
    elif (0.8 <= prob <= 1):
      female_08 += 1
    else:
raise Exception("Female not in range" + str(prob))- Male
  elif pred=='Male':
    if (0.2 <= prob < 0.4):
      male_02 += 1
    elif (0.4 <= prob < 0.6):
      male_04 += 1
    elif (0.6 <= prob < 0.8):
      male_06 += 1
    elif (0.8 <= prob <= 1):
      male_08 += 1
    else:
raise Exception("Male not in range" + str(prob))- Junior
  elif pred=='Junior':
    if (0.4 <= prob < 0.6):
      junior_04 += 1
    elif (0.6 <= prob < 0.8):
      junior_06 += 1
    elif (0.8 <= prob <= 1):
      junior_08 += 1
    else:
      raise Exception("Junior not in range" + str(prob))
Each has exception, to anticipate outliers.
Counting Total
This is also very primitive.
total = puppy + juvenile \
      + junior_04 + junior_06 + junior_08 \
      + female_02  + female_04  + female_06 + female_08 \
      + male_02  + male_04  + male_06 + male_08
Printing The Output
And this is another dumb code.
print('Puppy          : %3d' % puppy)
print('Juvenile       : %3d' % juvenile)
print('Junior 0.4-0.6 : %3d' % junior_04)
print('Junior 0.6-0.8 : %3d' % junior_06)
print('Junior 0.8-1.0 : %3d' % junior_08)
print('Female 0.2-0.4 : %3d' % female_02)
print('Female 0.4-0.6 : %3d' % female_04)
print('Female 0.6-0.8 : %3d' % female_06)
print('Female 0.8-1.0 : %3d' % female_08)
print('Male 0.2-0.4   : %3d' % male_02)
print('Male 0.4-0.6   : %3d' % male_04)
print('Male 0.6-0.8   : %3d' % male_06)
print('Male 0.8-1.0   : %3d' % male_08)
print('------------------------')
print('Total          : %3d' % total)
I know it is dumb. But it works as a starter.
The Result
We haven’t had our pivot yet. But the output is clean enough.
Puppy          :   1
Juvenile       :  15
Junior 0.4-0.6 :   0
Junior 0.6-0.8 :   0
Junior 0.8-1.0 :   0
Female 0.2-0.4 :   0
Female 0.4-0.6 :   8
Female 0.6-0.8 :   2
Female 0.8-1.0 :   1
Male 0.2-0.4   :   0
Male 0.4-0.6   :   9
Male 0.6-0.8   :   3
Male 0.8-1.0   :   1
------------------------
Total          :  40
What is Next 🤔?
It is pretty bad code for a starter. It means we have a lot to be improved.
Consider continue reading [ Python - Excel - Pivot - Part Two ].