Preface
Goal: Build a custom multi column pivot table using LibreOffice Macro.
This is a multipart article:
-
Read the data and output to console.
-
Write the output to sheet.
Why Pivot?
My boss said summary.
I have weekly report to be delivered to management. This include a bunch of pivot table and charts.
Why Macro?
Just like Excel, LibreOffice Calc can manage pivot table. But just like Excel, Calc can only manage one data source at a time. If I should compare between data source, I should make the pivot one by one, and copy-paste the result.
It is a daunting process, and also error prone. So I decide to make my own multicolumn pivot generator.
Why Python?
Bigger ecosystem. Large community base.
What Source?
The Puppy Case.
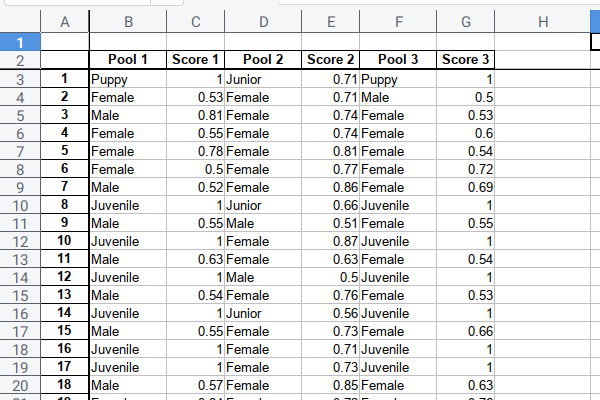
Imagine a case, you have three cameras that could identify dogs, by gender and age, and also with the confidence score.
All cameras identify the length of the dog, if the dog is short, it simply puppy without probabilty. Otherwise it is an adult dog, that could be female or male, with probability. Between adult and puppy there is other category as well.
Each camera come from different vendor,
thus different terminology.
The first and the third use the junior word with probability.
While the second camera use juvenile word without probability.
You can build a custom multicolumn pivot table. Then manually copy the format from a template, to get nice gradient looks as below worksheet.
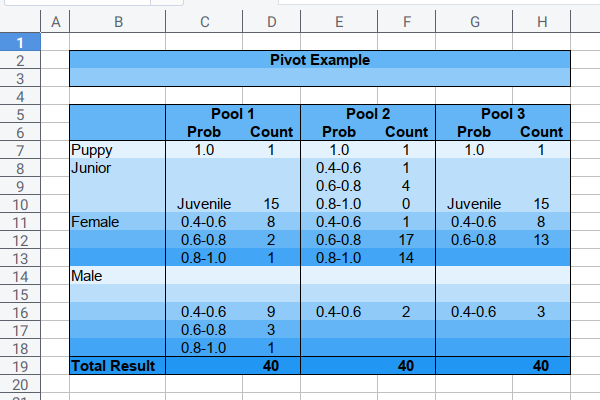
The figure above is a simplification of real data.
Example Data
You can download here
This consist of three sheets.
I’m making the output mockup first. And code later. I mostly code, after making output model. The output could be changed later, as the code process begun.
Why Automation?
Time savings.
We should invest on thinking, rather than doing tedious repetitive task.
1: Start Simple Code using OOP
It is a good idea, to make your macro tidy, by organizing each part in Object Oriented manners. This means bundle each function in class.
For a starter. Consider begin with simple example. Just read cells value.
Macro Skeleton
Have a look at this source code.
# coding: utf-8
from __future__ import unicode_literals

class DogSample:
  def __init__(self):
    # ...

  def display(self):
    # ...

def main():
  sample = DogSample()
  sample.display()
We will call main() from console.
main()Class Initialization
We need to get sheet right.
  def __init__(self):
    document = XSCRIPTCONTEXT.getDocument()
    self.sheet_src = document.Sheets["Combined"]
This is the first thing to do.
Displaying into Console
This will read a few row, for this value:
- Prediction
- Probability
  def display(self):
    sheet = self.sheet_src

    name_pred = 'B'
    name_prob = 'C'
    rows = range(3, 8)
    for row in rows:
      column_pred = sheet["%s%d" % (name_pred, row)]
      column_prob = sheet["%s%d" % (name_prob, row)]

      pred = column_pred.String
      prob = column_prob.Value

      if not (type(prob) == int or type(prob) == float): continue

      print(f'Prediction  : {pred}')
      print(f'Probability : {prob:.2f}')
Output Result
>>> main()
Prediction  : Puppy
Probability : 1.00
Prediction  : Female
Probability : 0.53
Prediction  : Male
Probability : 0.81
Prediction  : Female
Probability : 0.55
Prediction  : Female
Probability : 0.78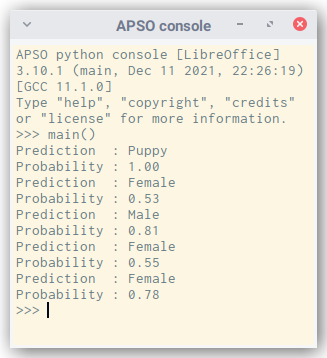
2: Complete Class for Output Mockup
This is more like almost complete class. Except this class purpose only serve, for displaying console output.
We will write to spreadsheet, in the next chapter.
Macro Skeleton
The big picture of the Dog Class.
Have a look at this source code.
# coding: utf-8
from __future__ import unicode_literals

class DogSample:
  # ...

  def __init__(self, sheet_name, rows):
    # ...

  def reset(self):
    self.sample = {
      # ...
    }

  def get_total(self):
    return # ...

  def display_to_console(self):
    # ...

  def update(self, pred, prob):
    # ...

  def walk_each_row(self):
    for row in self.rows:
      # ...

  def pivot(self, title, name_pred, name_prob):
    # ...

def main():
  # ...
Main Function
We deal with the book part in main function. I think, it is more tidy this way.
def main():
  r_start =  3
  r_stop  = 43
  rows = range(r_start, r_stop)

  sample = DogSample("Combined", rows)
  sample.pivot('First Pool',  'B', 'C')
  sample.pivot('Second Pool', 'D', 'E')
  sample.pivot('Third Pool',  'F', 'G')
Dog Class Property
Probability Grouping Category
The only property is this one below:
class DogSample:
  str_ranges   = { 20: '0.2-0.4', 40: '0.4-0.6',
                   60: '0.6-0.8', 80: '0.8-1.0' }
We will need this property as, category group of each probability.
Dog Class Initialization
We only initialize two variables
sheet_src,rows
  def __init__(self, sheet_name, rows):
    document   = XSCRIPTCONTEXT.getDocument()
    sheet_src  = document.Sheets[sheet_name]

    self.sheet_src = sheet_src
    self.rows      = rows
Pivot Method
It still consist of three function.
And it also initialize three variables
title,name_pred,name_prob
  def pivot(self, title, name_pred, name_prob):
    self.title     = title
    self.name_pred = name_pred
    self.name_prob = name_prob

    self.reset()
    self.walk_each_row()
    self.display_to_console()
Defining Property
We should reset the counter for each calls. We also bundle all property into one dictionary.
  def reset(self):
    self.sample = {
      'puppy'    : 0,
      'juvenile' : 0,
      'junior'   : { 40: 0, 60: 0, 80: 0 },
      'female'   : { 20: 0, 40: 0, 60: 0, 80: 0 },
      'male'     : { 20: 0, 40: 0, 60: 0, 80: 0 }
    }
The number of 20, 40, 60, 80 is probability category.
Walk The Loop
The scanning process is very similar, with the plain function version.
  def walk_each_row(self):
    for row in self.rows:
      pred_col = self.sheet_src[self.name_pred + str(row)]
      prob_col = self.sheet_src[self.name_prob + str(row)]

      pred = pred_col.value

      if prob_col.value == None: continue
      else:
        prob = float(prob_col.value)
        self.update(pred, prob)
This require update method.
Two Level Conditional
This would take two level conditional.
The outer just based on prediction,
and the inner count its probability.
The skeleton of the outer conditional is as below
  if pred=='Female':
    # ...
  elif pred=='Male':
    # ...
  elif pred=='Junior':
    # ...
  elif pred=='Juvenile':
    juvenile += 1
  elif pred=='Puppy':
    puppy += 1
There is three prediction that require probability.
- Female
- Male
- Junior
Updating Sample Count
Conditional Optimization
This is the place where, each sample update count.
  def update(self, pred, prob):
    # s is just a shorter form of sample variable
    s = self.sample

    probint   = int(prob*100)
    probfloor = probint - (probint % 20)

    if pred=='Female':
      if   (0.2 <= prob <= 1): s['female'][probfloor] += 1
      else: raise Exception("Female not in range" + str(prob))
    elif pred=='Male':
      if   (0.2 <= prob <= 1): s['male'][probfloor] += 1
      else: raise Exception("Male not in range" + str(prob))
    elif pred=='Junior':
      if   (0.4 <= prob <= 1): s['junior'][probfloor] += 1
      else: raise Exception("Junior not in range" + str(prob))
    elif pred=='Juvenile':
      s['juvenile'] += 1
    elif pred=='Puppy':
      s['puppy'] += 1

    self.sample = s
I’m not fond of long code,
so I make the s shortcut.
Counting Total
We bundle the total count into method. With help of sum of dictionary.
  def get_total(self):
    return self.sample['puppy'] \
         + self.sample['juvenile'] \
         + sum(self.sample['junior'].values()) \
         + sum(self.sample['female'].values()) \
         + sum(self.sample['male'].values())
Printing The Output
Bundle, as usual:
  def display_to_console(self):
    # shorter form of sample variable
    s = self.sample
    sr = self.str_ranges

    print(self.title)
    print('------------------------')
    print('Puppy            : %3d' % s['puppy'])
    print('Juvenile         : %3d' % s['juvenile'])
    for key in [40, 60, 80]:
      print('Junior %s   : %3d' % (sr[key], s['junior'][key]))
    for key in [20, 40, 60, 80]:
      print('Female   %s : %3d' % (sr[key], s['female'][key]))
    for key in [20, 40, 60, 80]:
      print('Male     %s : %3d' % (sr[key], s['male'][key]))
    print('------------------------')
    print('Total            : %3d' % self.get_total())
    print()
This method is just, printing to console.
The Result
>>> main()
First Pool
------------------------
Puppy            :   1
Juvenile         :  15
Junior 0.4-0.6   :   0
Junior 0.6-0.8   :   0
Junior 0.8-1.0   :   0
Female   0.2-0.4 :   0
Female   0.4-0.6 :   8
Female   0.6-0.8 :   2
Female   0.8-1.0 :   1
Male     0.2-0.4 :   0
Male     0.4-0.6 :   9
Male     0.6-0.8 :   3
Male     0.8-1.0 :   1
------------------------
Total            :  40

Second Pool
...

Third Pool
...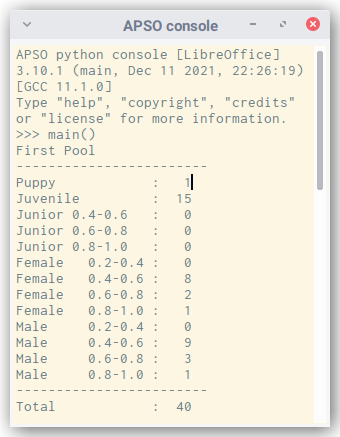
Our multicolumn pivot is based on these value above. We will show the result in spreadsheet in the next part.
What is Next 🤔?
We are done with CLI output. Now it is a good time to write the output to the sheet.
Consider continue reading [ LibreOffice - Custom Pivot - Part Two ].